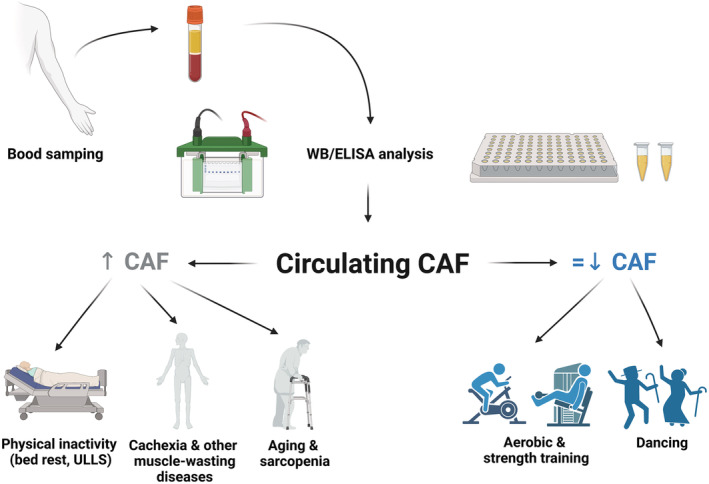
Figure 2.

CAF and ageing, sarcopenia, disease and physical activity and inactivity. Schematic representation of CAF concentration measurement and the main findings provided by the literature. On the left side of the picture: Physical inactivity, ageing and sarcopenia, muscle‐wasting disease (in grey), as the conditions in which CAF has been reported to increase or be higher than controls. On the right side of the picture: Physical activity and dance (in blue), as the conditions in which CAF has been mainly reported to be either maintained or reduced. WB, western blot; ELISA, enzyme‐linked immunosorbent assay; ULLS, unilateral lower limb suspension; CAF, C‐terminal agrin fragment.
