
Figure 2.
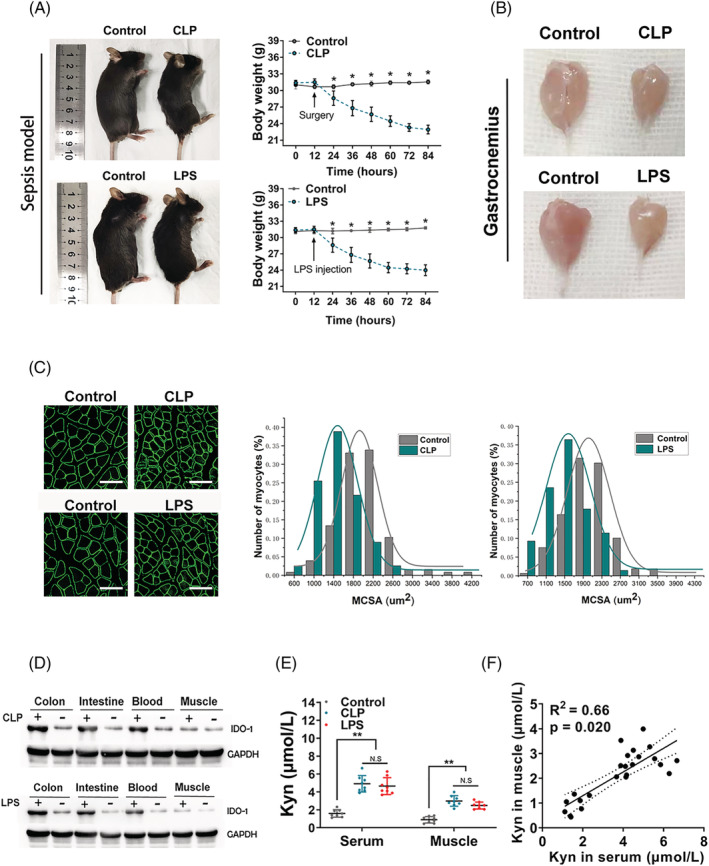
The indoleamine 2,3‐dioxygenase 1 (IDO‐1) expression is up‐regulated in the intestine and blood from both caecal ligation and puncture (CLP) and lipopolysaccharide (LPS) injection mouse models. (A) Images (left) and body weight analysis (right) of intra‐abdominal sepsis (IAS) (CLP and LPS injection) and control (non‐IAS) mice (C57BL/6 background). Images were photographed at endpoint at 72 h after CLP or LPS injection. (B) Representative images of the gastrocnemius muscles between the IAS and non‐IAS mice were shown. (C) Representative laminin staining and associated morphometric analysis of cross‐sections of gastrocnemius muscles harvested from IAS and non‐IAS mice. Scale bars, 100 μm. Morphometric analysis is depicted as the distribution frequency of fibre size categorized by fibre diameter. (D) IDO‐1 protein expression as determined by western blot in the colon, intestine, blood and muscle from the indicated groups (n = 5 in each group). (E) Measurement of kynurenine (Kyn) production in the serum and gastrocnemius from C57BL/6 control mice and mice at 72 h after CLP or LPS injection (n = 8 in each group). (F) Pearson correlation of the Kyn concentration between the serum (x axis) and gastrocnemius (y axis), with R 2 = 0.66 and P value = 0.020. All data are shown as mean ± SEM. P values were determined by two‐tailed, unpaired Student's t test or one‐way analysis of variance (ANOVA). N.S, not significant. *P < 0.05, ** P < 0.01 and *** P < 0.001.