Figure 1.

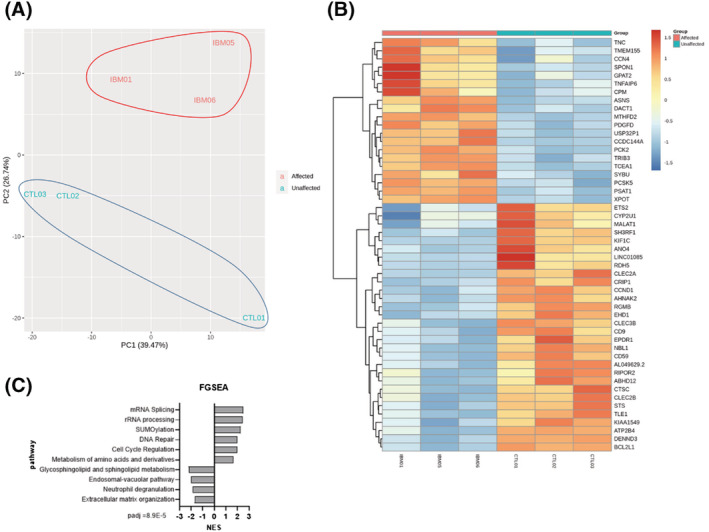
Transcriptome analysis of IBM and CTL fibroblasts (n = 3/group). (A) Principal component analysis (PCA) of affected (IBM) versus unaffected (CTL) subjects. (B) Heatmap of the top 50 differentially expressed genes (DEGs) obtained in a differential expression analysis between both cohorts. All DEGs are represented in Table S1. (C) Top pathways (with lowest P‐value adj) after a functional gene set enrichment analysis (GSEA) and considering their normalized enrichment score (NES). PCA, heatmap and pathway analysis revealed a differential gene expression pattern in IBM patients, with DEGs and pathways related to inflammation, mitochondria and other processes like cell cycle regulation and metabolism of amino acids and derivatives.
