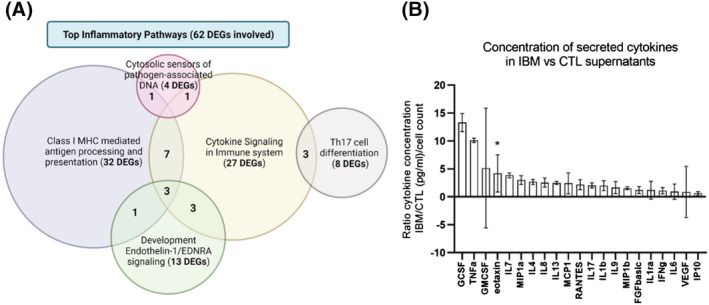
Figure 2.

The inflammatory pattern of IBM and CTL fibroblasts. (A) Venn's diagram of the most affected inflammatory clusters and the number of differentially expressed genes (DEGs) involved. Some DEGs are involved in more than one cluster. The list of inflammatory DEGs is represented in Table S2. (B) Mean fold change ratio (and deviation) of secreted cytokines in IBM patients versus CTL fibroblasts, normalized by cell number (n = 13 IBM vs. 12 CTL; *P‐value < 0.05, Mann–Whitney U test) (ratio > 1: Higher concentration in IBM). The concentration of each cytokine and their full names are represented in Table S3. Briefly, an increased inflammatory profile is observed in IBM versus CTL fibroblasts, with differentially expressed genes (DEGs) related to MHC1, cytokines, interleukins, and so on and higher cytokine secretion in fibroblast supernatants.
