Figure 3.

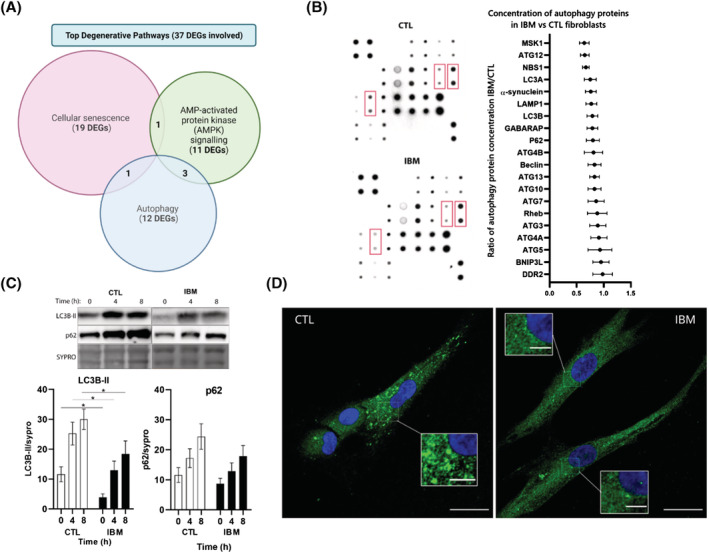
Autophagy in IBM versus CTL fibroblasts. (A) Venn's diagram of the most affected degenerative clusters and the number of differentially expressed genes (DEGs) involved. Some DEGs are involved in more than one cluster. The list of degenerative DEGs is represented in Table S2. (B) Representative images of two autophagy protein arrays of one inclusion body myositis (IBM) and one control (CTL) fibroblast and quantification of n = 8/group autophagy protein arrays. In red, differences in protein concentration (according to spot intensity) among IBM and CTL fibroblasts. In the graph, mean fold change ratio (and deviation) of autophagy proteins in IBM patients versus CTL fibroblasts, normalized by protein content (ratio < 1: Lower concentration in IBM). Each protein concentration is depicted in Table S4. (C) Representative images and graphs of an autophagy time‐course (at basal, 4 h and 8 h under bafilomycin A1 treatment) measured by western blot between IBM (n = 13) and CTL (n = 12) fibroblasts. Results: Mean ± SEM, n = 13 IBM versus 11 CTL; Kruskal–Wallis test, *P‐value < 0.05. SQSTM1/p62: Autophagy substrate, LC3BII: Autophagy receptor, lipidated form, sypro: Total protein content. (D) Representative images of autophagosome accumulation in IBM versus CTL fibroblasts treated with bafilomycin A1 (100 nM) for 6 h obtained by confocal microscope (LC3B in green; nuclei in blue with DAPI, scale 25 μM (inserts 5 μM)). Briefly, autophagy is impaired in terms of differentially expressed genes (DEGs) and decreased expression of basal protein mediators, time‐course autophagosome formation, and microscopic evaluation.
