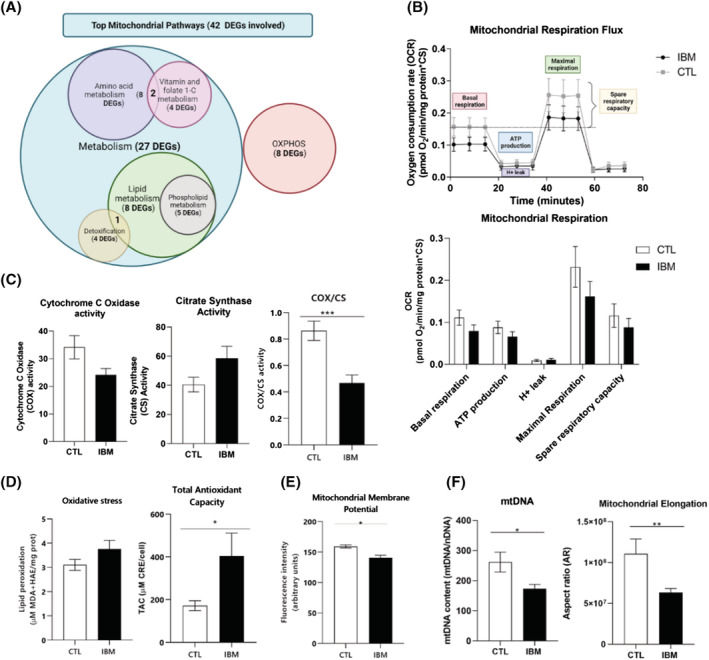
Figure 4.

Mitochondrial profile in IBM versus CTL fibroblasts. (A) Venn's diagram of the most affected mitochondrial clusters and the number of differentially expressed genes (DEGs) involved. Many DEGs are involved in more than one cluster. The list of mitochondrial DEGs is represented in Table S2. (B) Mitochondrial respiratory flux and rates of IBM versus CTL fibroblasts. Each sample was seeded in quadruplicate per condition (n = 10/group, Mann–Whitney U test). OCR = oxygen consumption rate. Respiratory control ratios were normalized by total protein content and by citrate synthase (CS) activity as a marker of mitochondrial content. (C) Cytochrome C oxidase (COX), citrate synthase (CS) and COX per CS activity (COX/CS ratio, as a marker of complex IV from the mitochondrial respiratory chain (MRC) per mitochondrial mass (n = 10/group, P‐value < 0.001, Mann–Whitney U test), normalized by protein content. (D) Oxidative stress measured through lipid peroxidation in IBM versus CTL fibroblasts normalized by total protein content (n = 9 IBM vs. 8 CTL, Mann–Whitney U test) (MDA: Malondialdehyde; HAE: Hydroxialkenal); coupled to Total antioxidant capacity (TAC) expressed as μM CRE (copper reducing equivalents) per total cell number (n = 11 IBM vs. 4 CTL, P‐value < 0.05, Mann–Whitney U test). (E) Mitochondrial membrane potential (MMP) measured with TMRM + Arimoclomol in IBM versus CTL fibroblasts (n = 4/group, P‐value < 0.05, Mann–Whitney U test). The results were expressed as mean ± SEM (*P < 0.05). (F) mtDNA genome content in IBM versus CTL fibroblasts expressed as the ratio of mtDNA 12S rRNA:nDNA RNase‐P (mitochondrial vs. nuclear encoded gene) (n = 9 IBM vs. 8 CTL, P‐value < 0.05, Mann–Whitney U test) and mitochondrial elongation (represented by the aspect ratio) in IBM versus CTL fibroblasts (n = 3/group, P‐value < 0.05, Mann–Whitney U test). Briefly, mitochondrial performance is disturbed in IBM versus CTL fibroblasts in terms of genetic content, differentially expressed genes (DEGs) and functionality (reduced respiratory profile, marked COX/CS decline, higher oxidative stress and antioxidant defence activation, reduced MMP and mitochondrial elongation).
