
Figure 6.
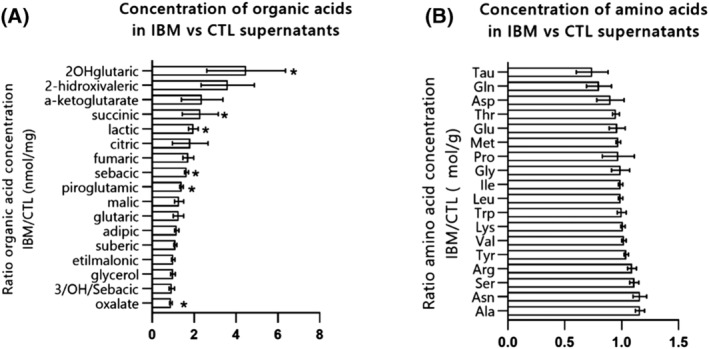
Metabolites concentration in IBM versus CTL fibroblasts. (A) Mean fold change ratio (and deviation) of organic acids in IBM patients versus CTL fibroblasts, normalized by protein content (n = 11 IBM vs. 10 CTL, *P‐value < 0.05, Mann–Whitney U test) (ratio > 1: Higher concentration in IBM). The raw data of each organic acid concentration is represented in Table S6. (B) Mean fold change ratio (and deviation) of amino acids IBM patients versus CTL fibroblasts, normalized by protein content (n = 11 IBM vs. 10 CTL, Mann–Whitney U test) (ratio > 1: Higher concentration in IBM; ratio < 1: Lower concentration in IBM). The raw data of each amino acid concentration is represented in Table S7. Briefly, organic acid levels showed a general increase in IBM, suggesting deregulation of intermediary metabolism related to mitochondrial dysfunction, whereas no relevant differences in amino acid levels were observed between IBM and CTL fibroblasts.