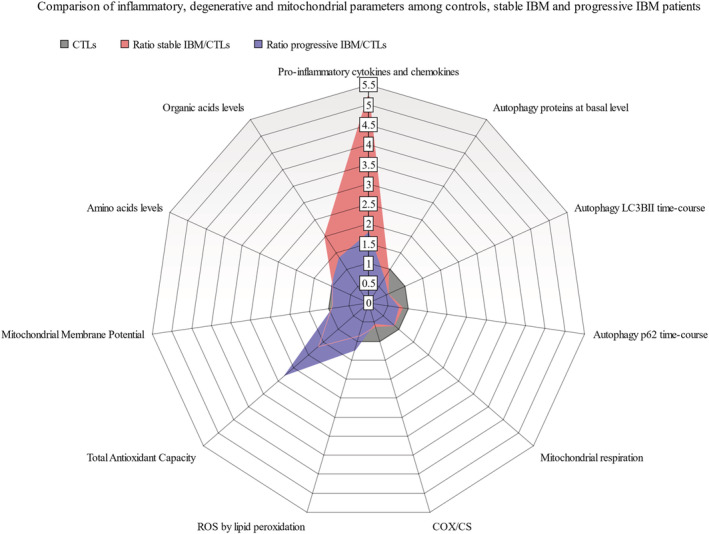
Figure 7.

Comparison of inflammatory, degenerative and mitochondrial parameters among controls (CTLs), IBM patients with stable evolution (stable IBM) and IBM patients with disease progression (progressive IBM). Ratios between IBM (stable or progressive) and control fibroblasts were measured to compare inflammatory, degenerative and mitochondrial parameters among the three groups (Table S8). Briefly, stable IBM showed an increased pro‐inflammatory and organic acids signature compared with progressive IBM and controls. Progressive IBM showed increased oxidative stress (ROS) and antioxidant capacity. Together, IBM stable and progressive present an evident decrease in LC3BII time‐course (autophagy marker) and COX/CS (cytochrome c oxidase related to citrate synthase, a marker of mitochondrial mass) with respect to CTLs (ratio > 1: Higher concentration in IBM; ratio < 1: Lower concentration in IBM).
