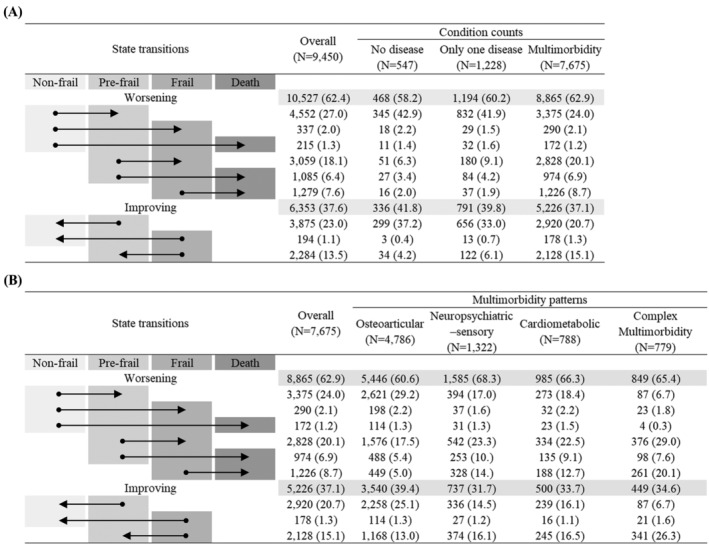
Figure 2.

Number (%) of observed transitions between frailty states and death by (A) condition counts and (B) multimorbidity patterns. Data are presented as numbers (percentages). The arrow displays the direction of the transition between frailty states and death.
