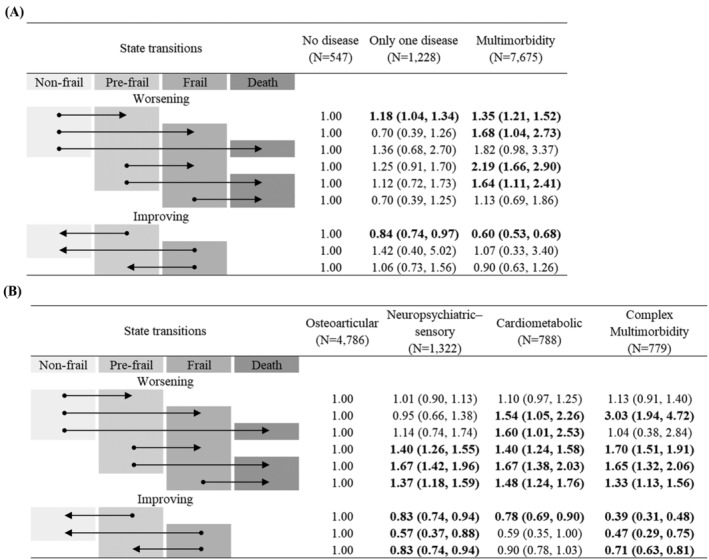
Figure 3.

Adjusted hazard ratios (95% confidence intervals) for (A) condition counts and (B) multimorbidity patterns. All models were adjusted for age, sex, race/ethnicity, residence, marital status, educational levels, smoking status and chronic pain. The arrow displays the direction of the transition between frailty states and death. Boldface indicates statistical significance (P < 0.05).
