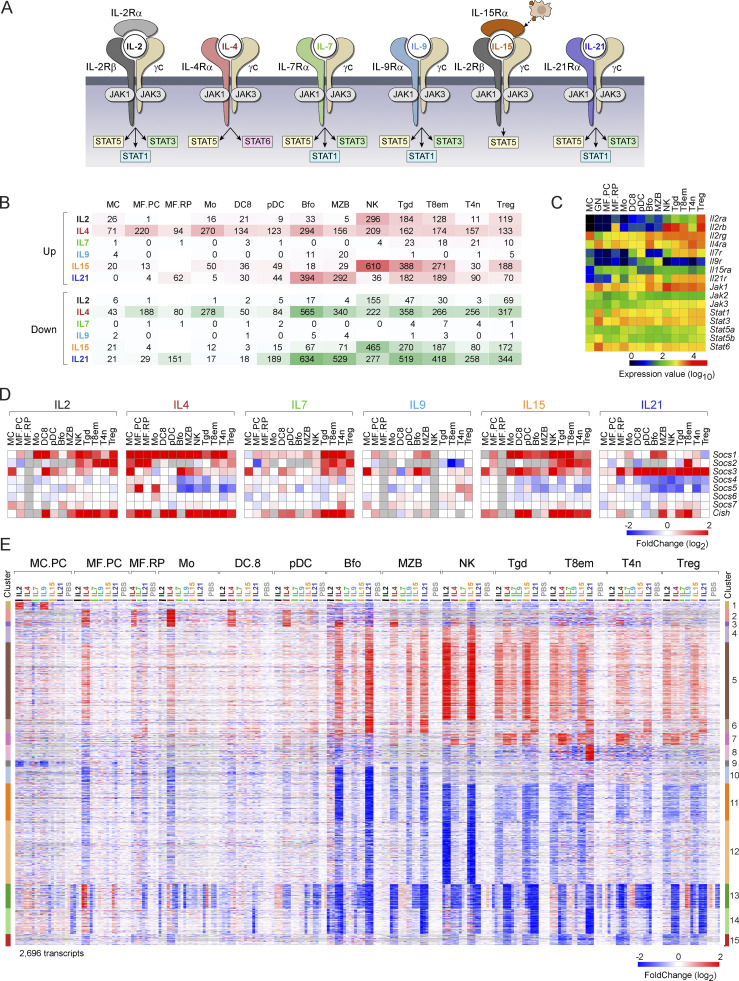
Figure 1.
Overview of early responses to γc cytokines. (A) A summary of the receptor and primary signal transducers for the γc cytokines used here (from Leonard et al., 2019). (B) Tally of the number of genes up- or downregulated (at arbitrary FC threshold of 2), 2 h after administration of indicated cytokines. See Table S2 for acronyms. (C) Expression of key receptors and signal transducers in the profiled cell-types (DEseq2 normalized values). (D) Induction of cytokine signal downregulators of the SOCS family (as FC relative to the mean of PBS controls in the matched experiments); gray cells: insufficient data. (E) Complete overview of 2,696 genes that significantly change in response to one or more γc cytokines, across all cell types. Activated and repressed clusters at right.

