Figure 2.
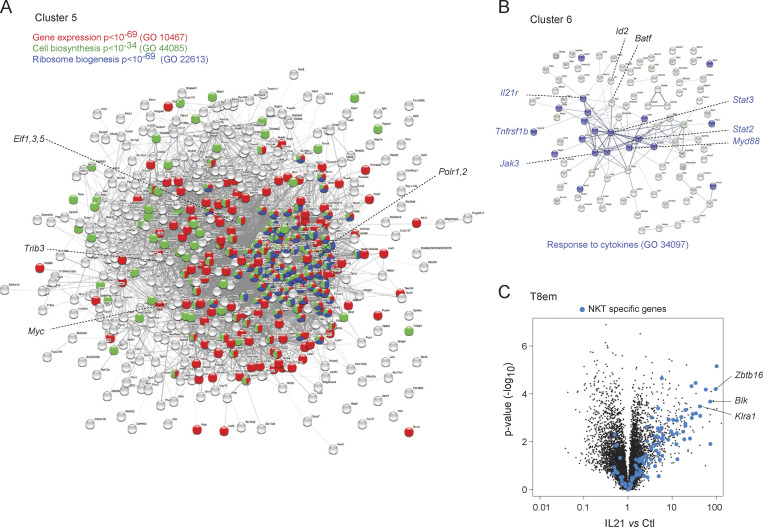
Composition of major response clusters. (A) Interaction map (String) of the main metabolic/biosynthetic Cluster 5 (from Fig. 1 E), annotated for major functional categories. (B) Cytokine signaling transcripts of Cluster 6. (C) Responses in CD8 T cells to IL21 (corresponding to Cluster 8), highlighted for transcripts that distinguish NKT from other CD4+ T cells. GO, GeneOntology.

