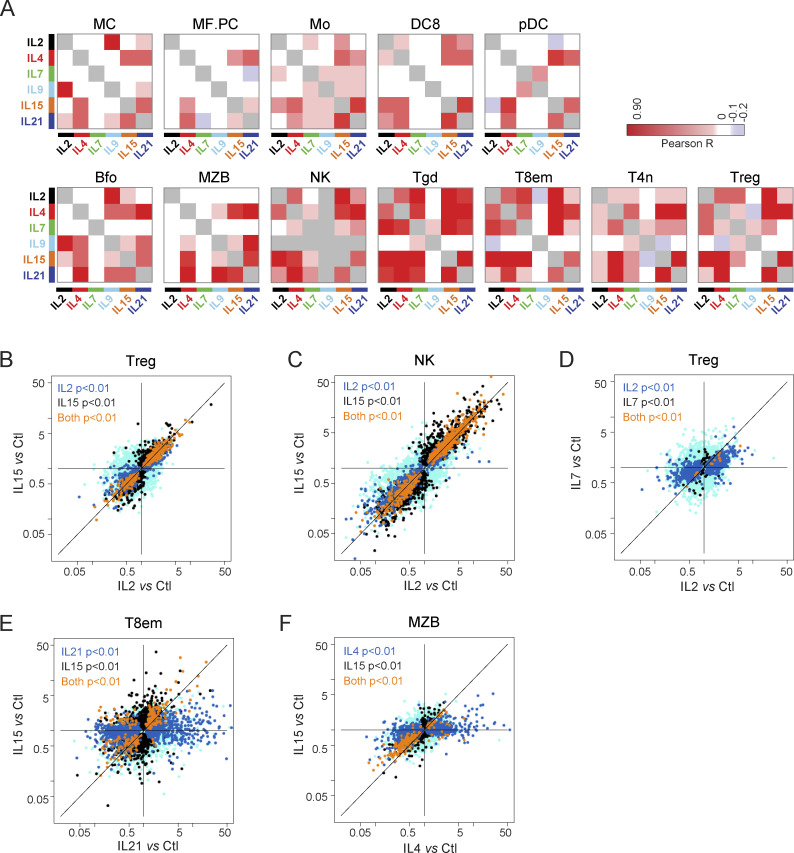
Figure 3.
Cell-type-specific relationship between responses to γc cytokines. (A) Correlation matrices between responses to γc cytokines in different cell types. (B–F) FC/FC plots relating changes induced by two cytokines in the same cell. Transcripts whose changes meet a t test P value <0.01 (uncorrected) in one or both treatment conditions are highlighted in different colors. See Table S2 for acronyms.

