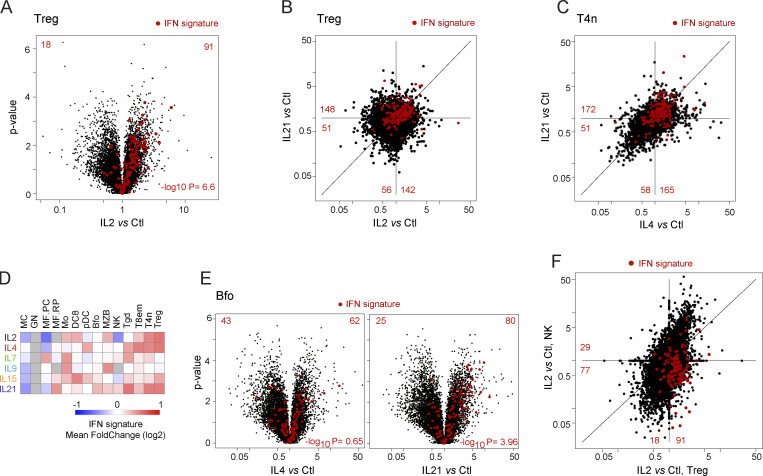
Figure 4.
Overlap between responses to Type-I IFN and γc cytokines. (A) Volcano plot of the response to IL2 in Tregs, with IFN signature genes (from Mostafavi et al., 2016) highlighted. (B) FC/FC plots comparing Treg responses to IL2 and IL21, with IFN signature genes highlighted. (C) As B, IL4, and IL21 in naive CD4+ T conventional cells. (D) Mean FC of IFN signature genes in all cytokine/cell pairs. See Table S2 for acronyms. (E) Volcano plots of responses to IL4 and IL21 in B cells, IFN signature genes highlighted. (F) As B, comparing responses to IL2 in Treg and NK cells.

