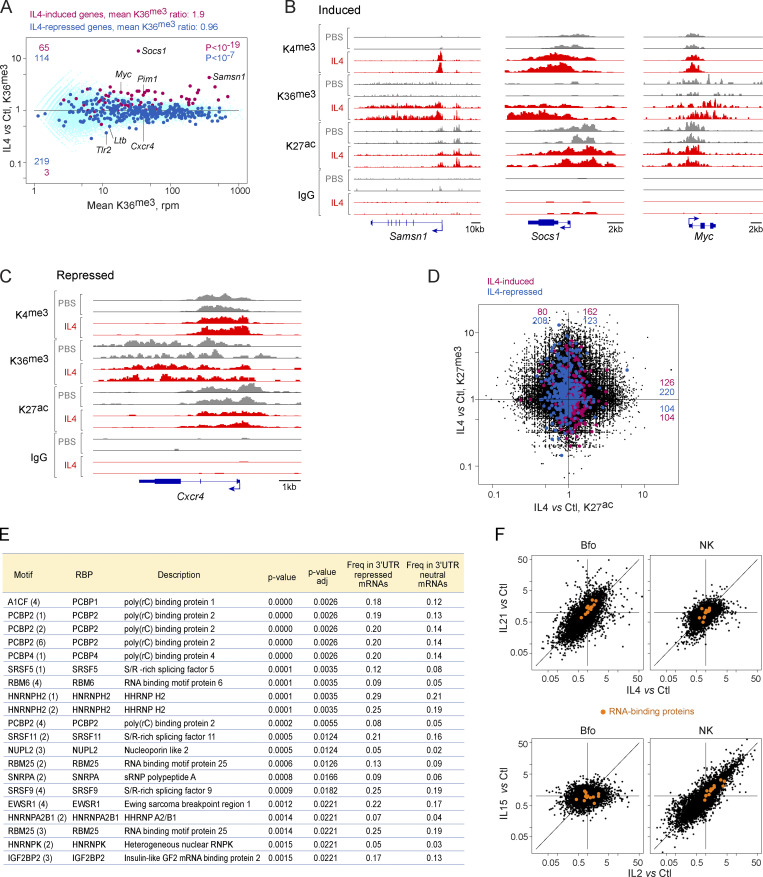
Figure 5.
Molecular mechanisms underlying responses to γc cytokines. Chromatin immunoprecipitation and sequencing (CUT&RUN) was used to analyze chromatin structure in Bfo, 2 h after in vivo administration of IL4 (or PBS control). (A) Integrated signal for H3.K36me3 across gene bodies, plotting mean signal vs. IL4/control FC at each locus. Red highlights: genes with IL4-induced mRNA >4-fold; blue: genes with IL4-repressed mRNA <0.25-fold. (B) Representative tracks across three genes whose mRNAs are induced by IL4 for H3.K4me3 (promoters), H3.K36me3, and H3.K27ac; precipitation with non-specific IgG shown as a control. (C) As B, for a representative repressed gene. (D) Relative changes in H3.K27ac (active enhancer) and H3.K27me3 (closed enhancer) after IL4 treatment. (E) Over-representation, computed with reference to oRNAment tables, in sequence motifs for RNA-binding proteins in the 3′UTRs of genes repressed by γc cytokines (1,055 Cluster 10–13 genes, Fig. 1 E), relative to 2,979 IL4-neutral taken as background reference. P value of the difference in frequencies. (F) Expression of transcripts encoding the RNA-binding proteins from E, shown as orange highlights, in Bfo and NK cells, treated with IL4 or IL21, and IL2 or IL15, respectively.

