Figure 6.
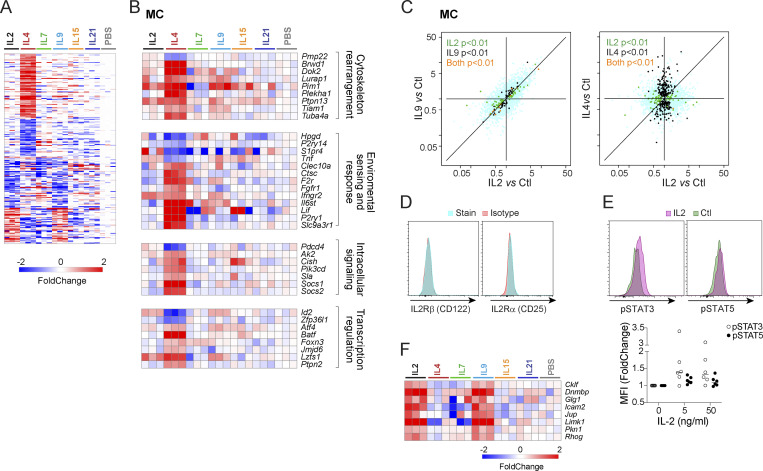
Unexpected responses to γc cytokines in MCs. (A) Heatmap of all significant changes (FC < 0.5 or > 2, with t test P < 0.01) induced by at least one γc cytokine in MCs, as log2 FC. (B) As A, focused on responses to IL4. (C) FC/FC plot comparing changes induced by IL2, IL9, and IL4 in MCs; t test P values color-coded as in Fig. 3 B. (D) Flow cytometric analysis of both chains of the conventional IL2 receptor on peritoneal MCs. (E) Flow cytometric detection of phosphorylated-STAT3 or STAT5, 30 min after in vitro treatment of peritoneal MCs with IL2 (5 ng/ml); control are parallel culture wells with no IL2; the results from several experiments are compiled at right (change in Mean Fluorescence Intensity [MFI] relative to untreated cells). (F) Focused heatmap of IL2 and IL9 responsive transcripts in MCs.

