Figure 7.
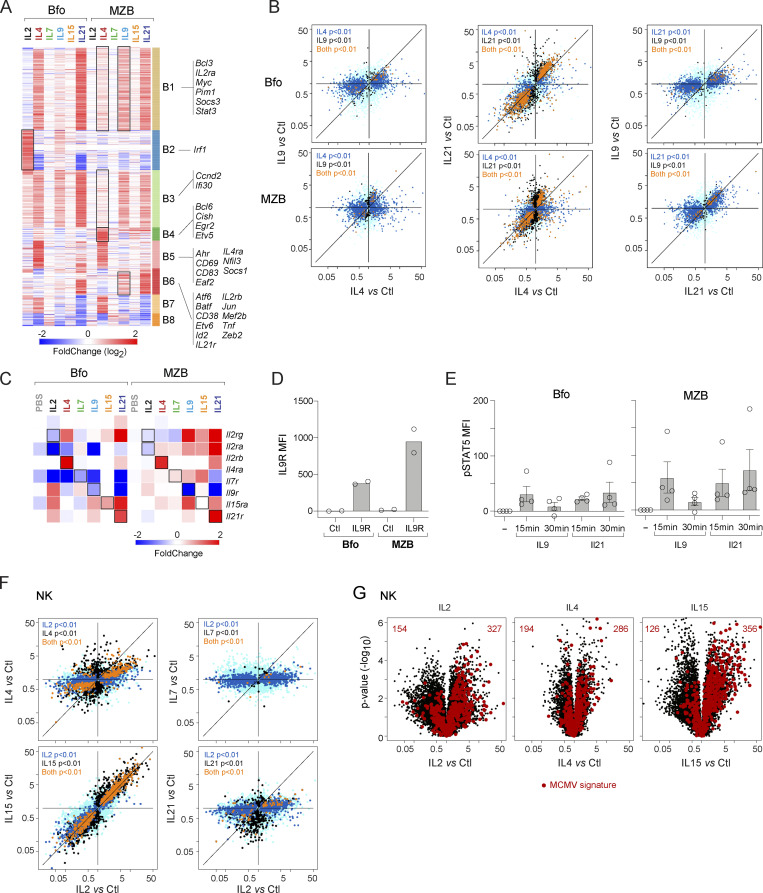
Unexpected responses to γc cytokines in B and NK cells. (A) Reclustered heatmap of all significant upregulations (FC > 2, with t test P < 0.01) induced by at least one γc cytokine in Bfo or MZB. Black squares indicate clusters differentially induced in Bfo and MZB. (B) FC/FC plots relating changes induced by two cytokines in either Bfo or MZB cells; color-coding of statistical significance as in Fig. 3 B. (C) Profound changes induced in transcripts encoding cytokine receptors in Bfo or MZB. (D) Flow cytometric detection (shown as MFI) of IL9R on Bfo or MZB cells—each dot is an independent experiment. (E) Flow cytometric detection of phosphorylated STAT5 after in vitro treatment of splenic B cells with IL9 or IL21. Control (no cytokine) MFI was subtracted from the test sample value. Each dot is an independent experiment. (F) FC/FC plot comparing changes induced by IL2 and other γc cytokines in NK cells; t test P values color-coded as in Fig. 3 B. (G) Changes elicited by γc cytokines in NK cells, with highlights corresponding to the signature of MCMV infection in NK (from Bezman et al., 2012).

