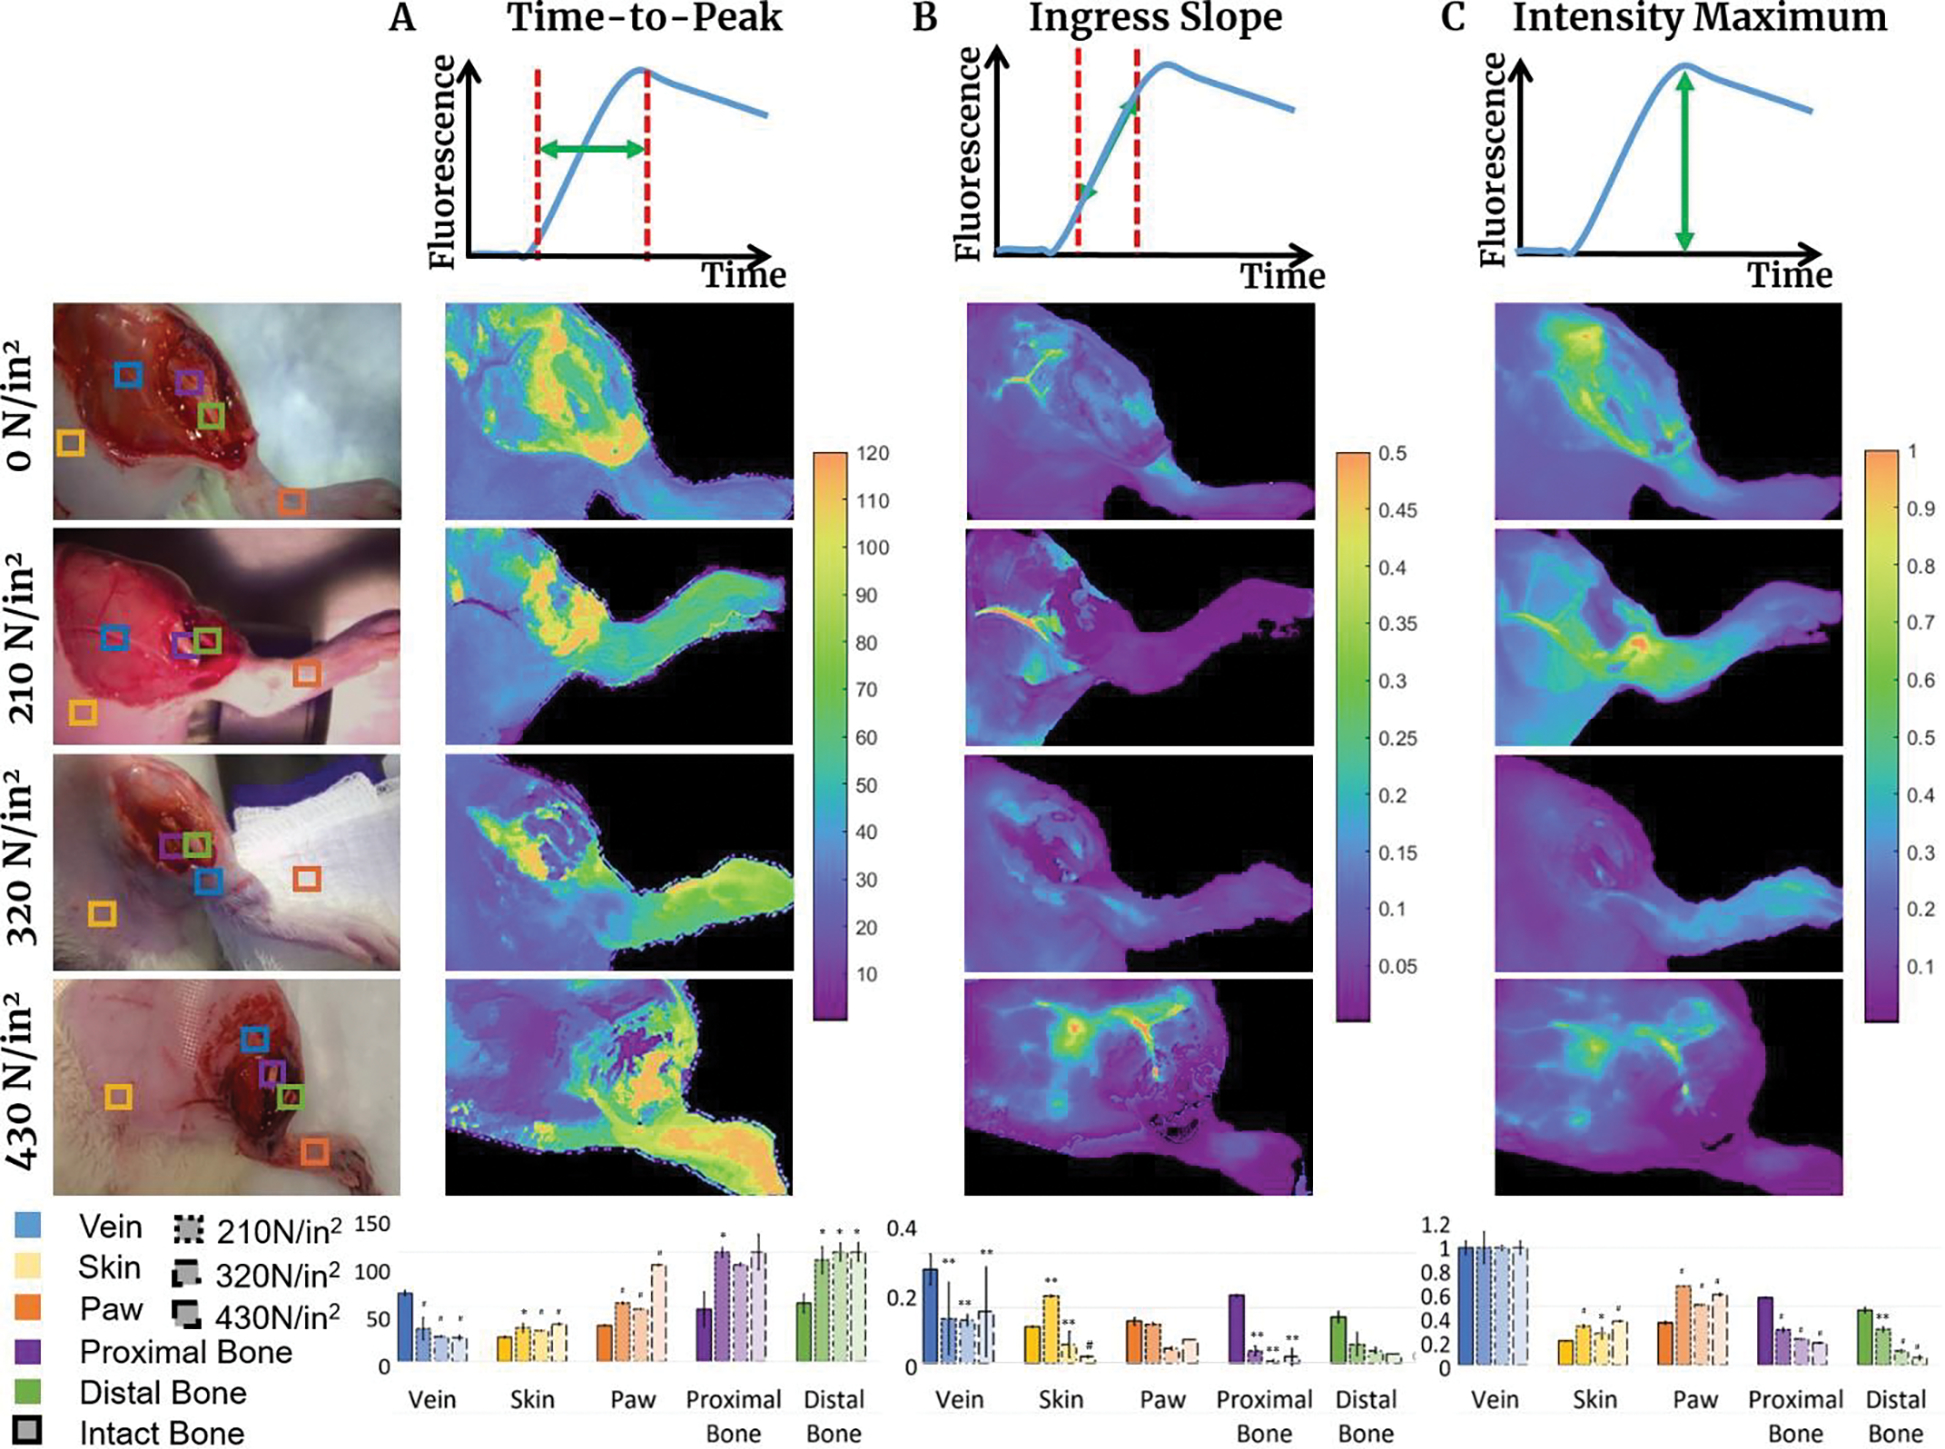
Figure 4.

Characteristic properties of fluorescence intensity profiles compared for each trauma level and ROI: (a) Time-to-peak (TTP) visualization, perfusion map for each trauma case, and ROI comparison bar graph. TTP defined by the time from 2% of maximum intensity to maximum intensity; (b) Ingress slope (IS) visualization, perfusion map for each trauma case, and ROI comparison bar graph. IS describes initial slope of the intensity profile defined between 25% of Imax and 75% of Imax; (c) Maximum Intensity (Imax) visualization, perfusion map for each trauma case, and ROI comparison graph. Imax described by point at which maximum fluorescence intensity is detected. It is normalized to the maximum intensity of the femoral vein ROI for each trauma case. * p < 0.05, ** p < 0.01, # p < 0.001.
