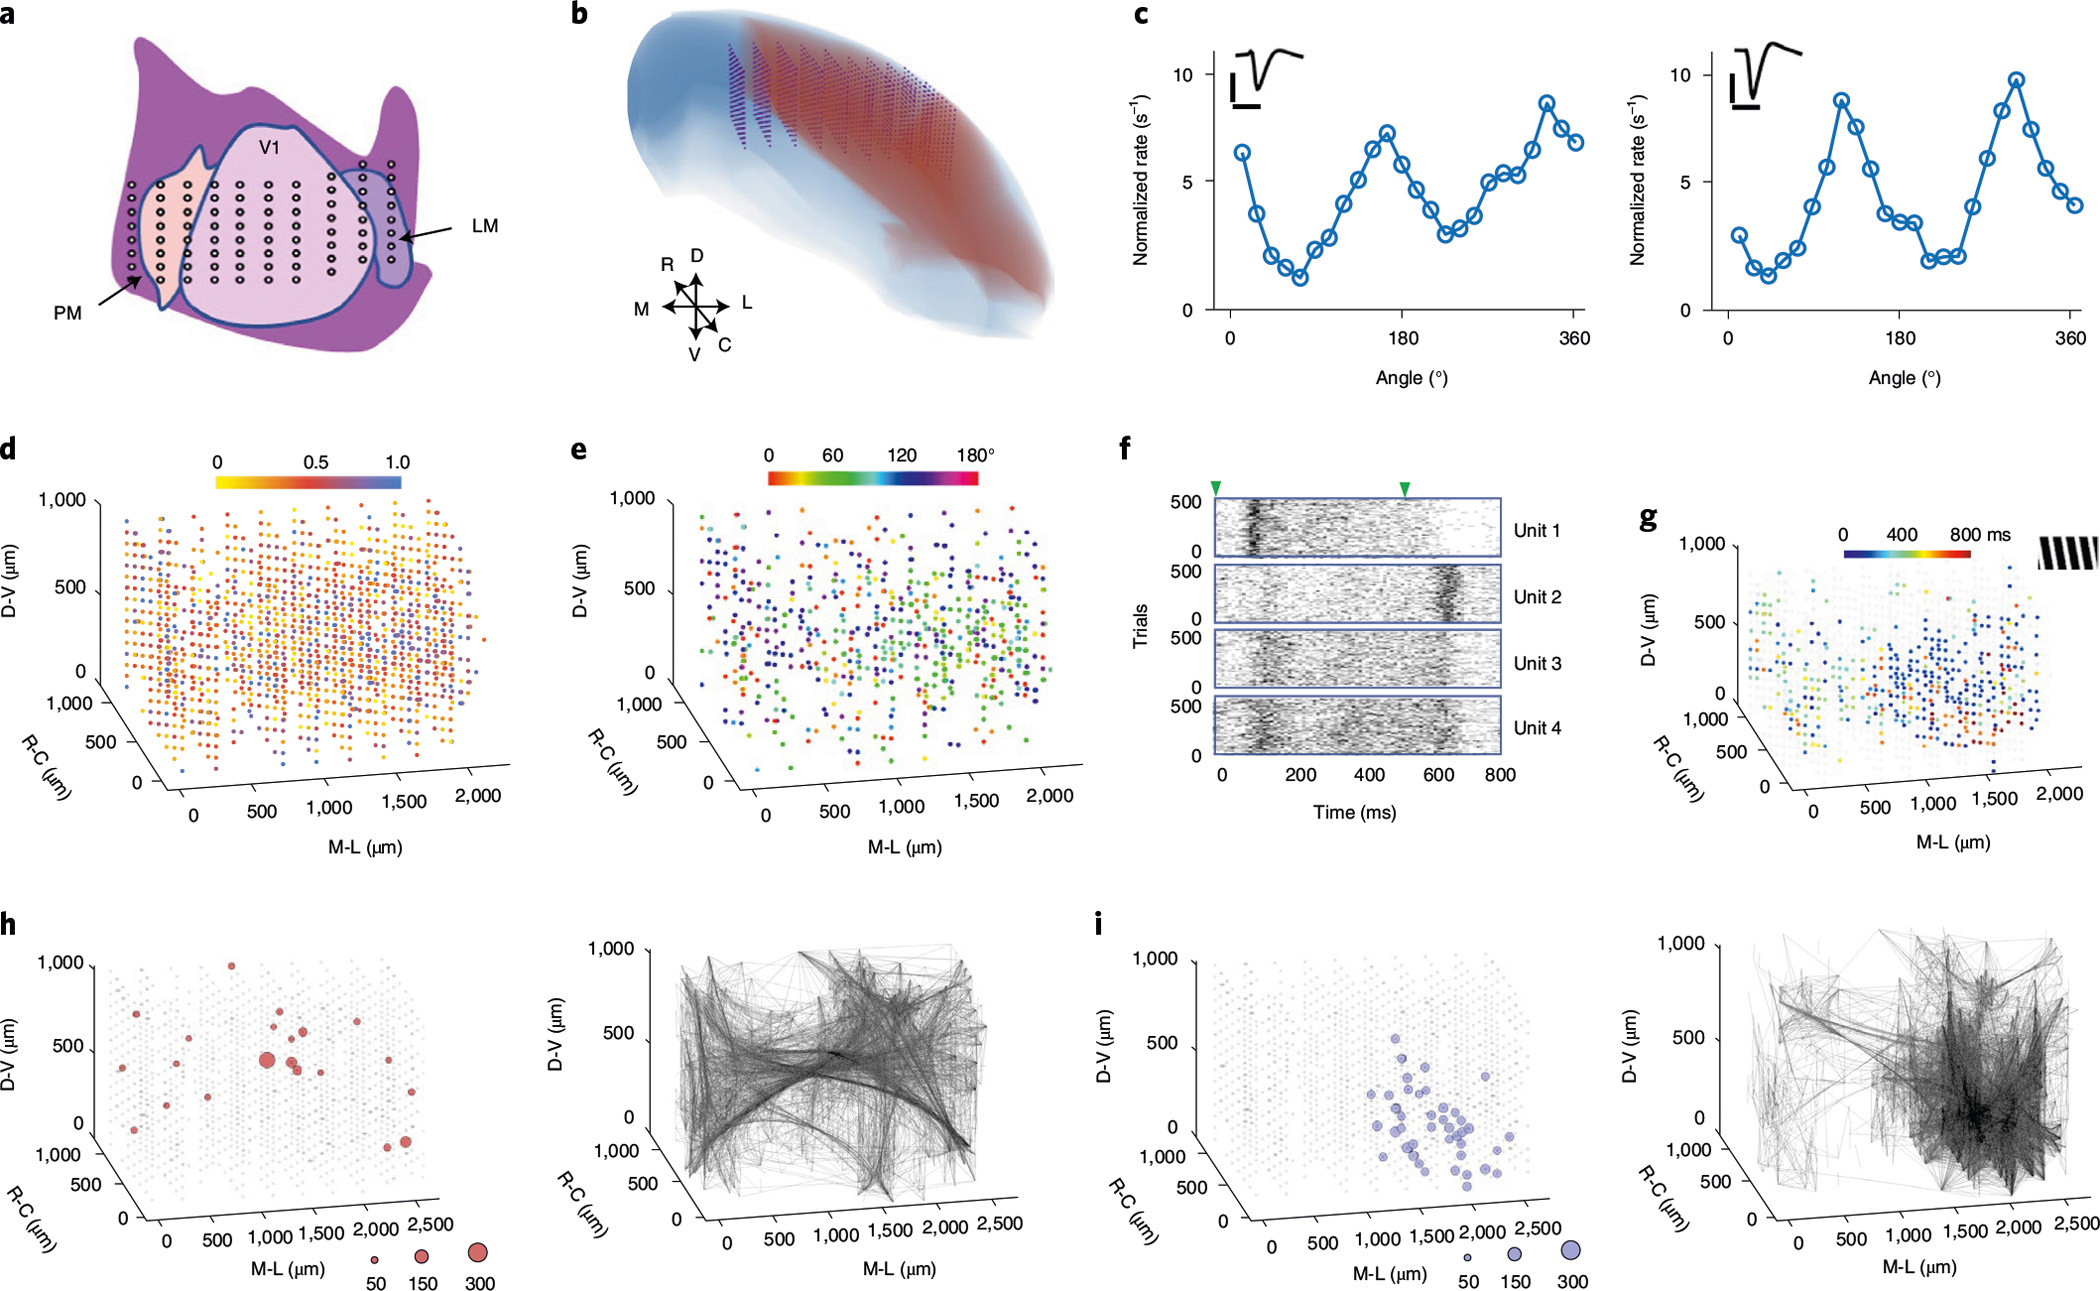
Fig. 3 |. Volumetric high-density mapping of the visual cortex in an awake head-fixed mouse.

a, Schematic representation of the targeted implantation location in the visual cortex. LM, lateromedial area; V1, primary visual cortex; PM, posteromedial area. Each dot represents a 16-channel shank. b, Reconstruction of expected locations of all 8 × 10 recording shanks (1,280 channels). Blue, neocortex of right hemisphere; red, visual area19; purple, NET arrays. D, V, R, C, M and L denote the orientations of dorsal, ventral, anterior, posterior, medial and lateral, respectively. c, Two sorted units recorded by the same contact in V1 showing distinct orientation tuning curves. Inset: unit waveforms. Scale bars, 1 ms (horizontal) and 100 μV (vertical). d, Colour-coded OSI for all recorded units (1,355 in total). All units are individually plotted as a sphere superimposed on the closest contact site. e, Preferred angle of grating for units with OSI > 0.5. f, Spike raster of 500 trials from representative units highlighting different temporal responses to grating stimuli. Triangles mark the start and end of the gratings. g, The peak firing time from the most active 30% of units under a stimulus of 165° drifting grating (shown in the upper right inset). h,i, Spatial distribution of the super nodes (left) and the strong couplings (right) without (h) and with (i) visual stimulation. The diameter of the circles is scaled to the number of couplings made at each node.
