
Fig. 5 |. Simultaneous volumetric recording and optogenetic stimulation.
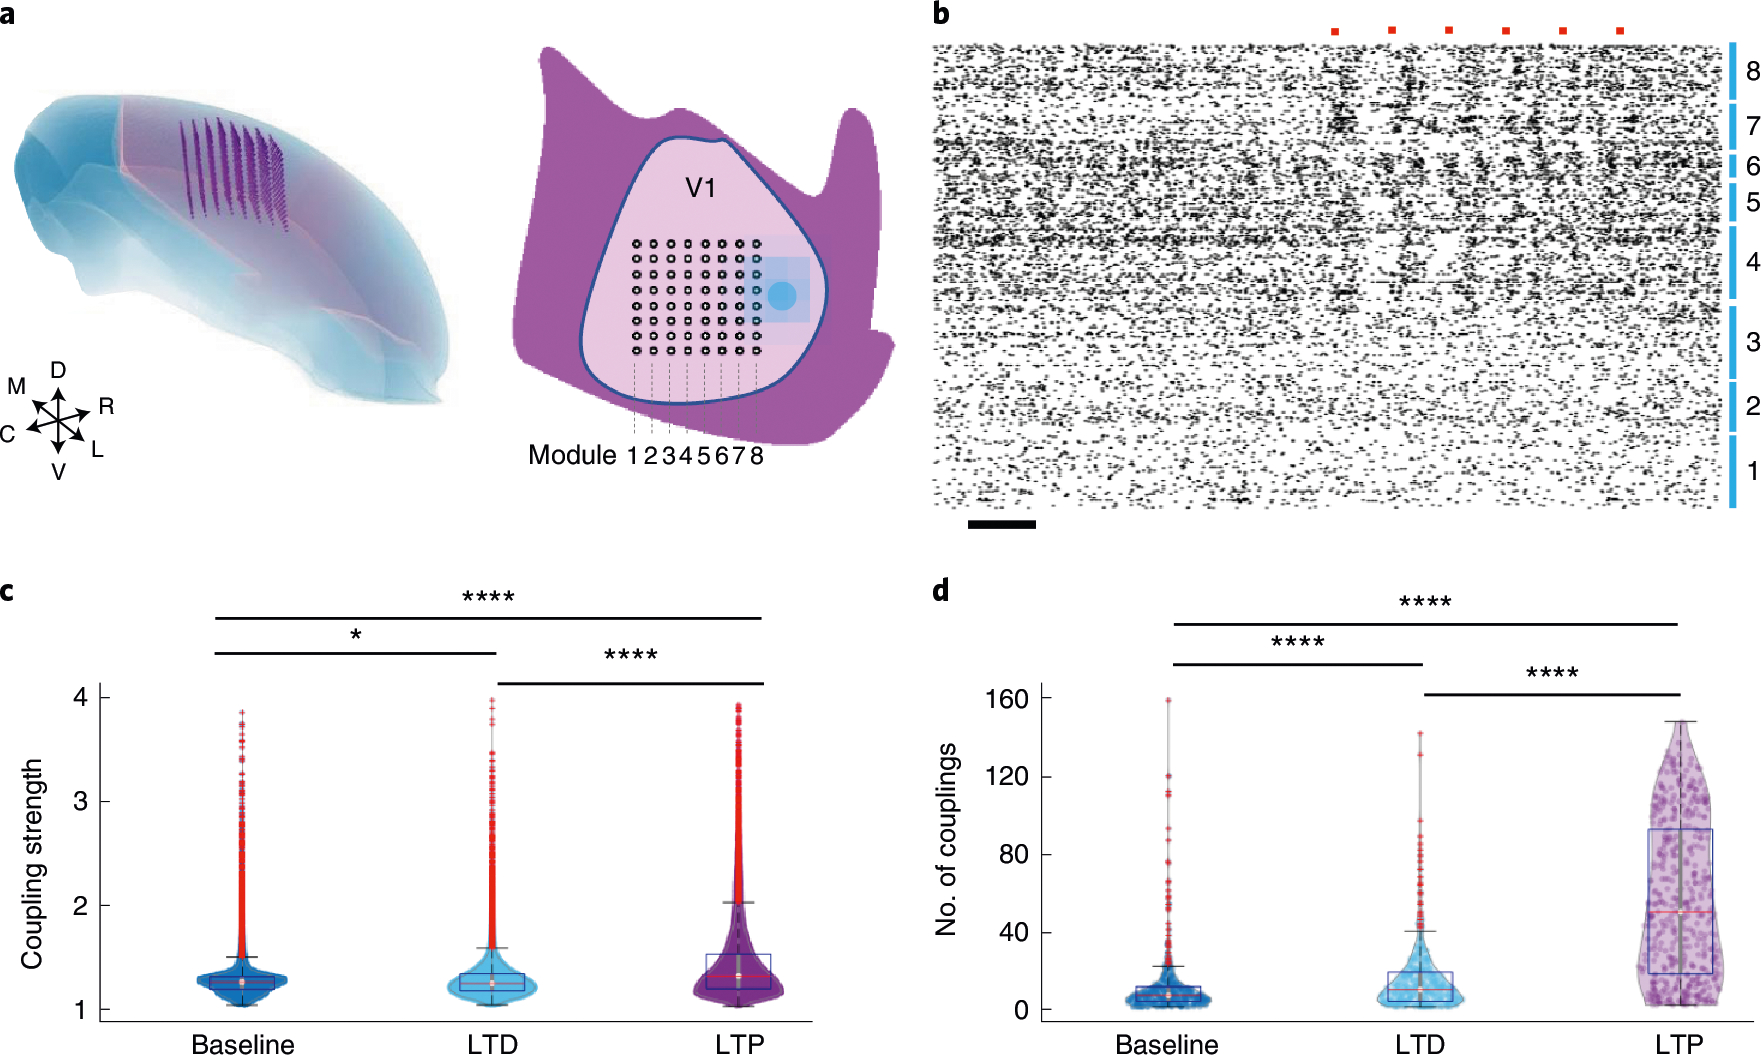
a, Schematic showing the targeted locations of the 8 × 8 × 16 recording sites in 3D (left), and the surface implantation locations for NET shanks (8 × 8) and the optical fibre (filled dot) in V1 (right). b, Spike raster of all 686 units recorded. Numbers mark the recording modules as in a. Orange dots mark the presence of optical stimulation. Scale bar, 0.1 s. c,d, Distribution of the couplings and nodes at baseline (blue), after optical LTD (cyan) and LTP (purple) protocols. Boxplots show the median, upper and lower 25%, and outliers. All data are shown in the violin plots. *P < 0.05, **P < 0.01, ****P < 0.0001, unpaired two-sided t-test, Bonferroni corrected.