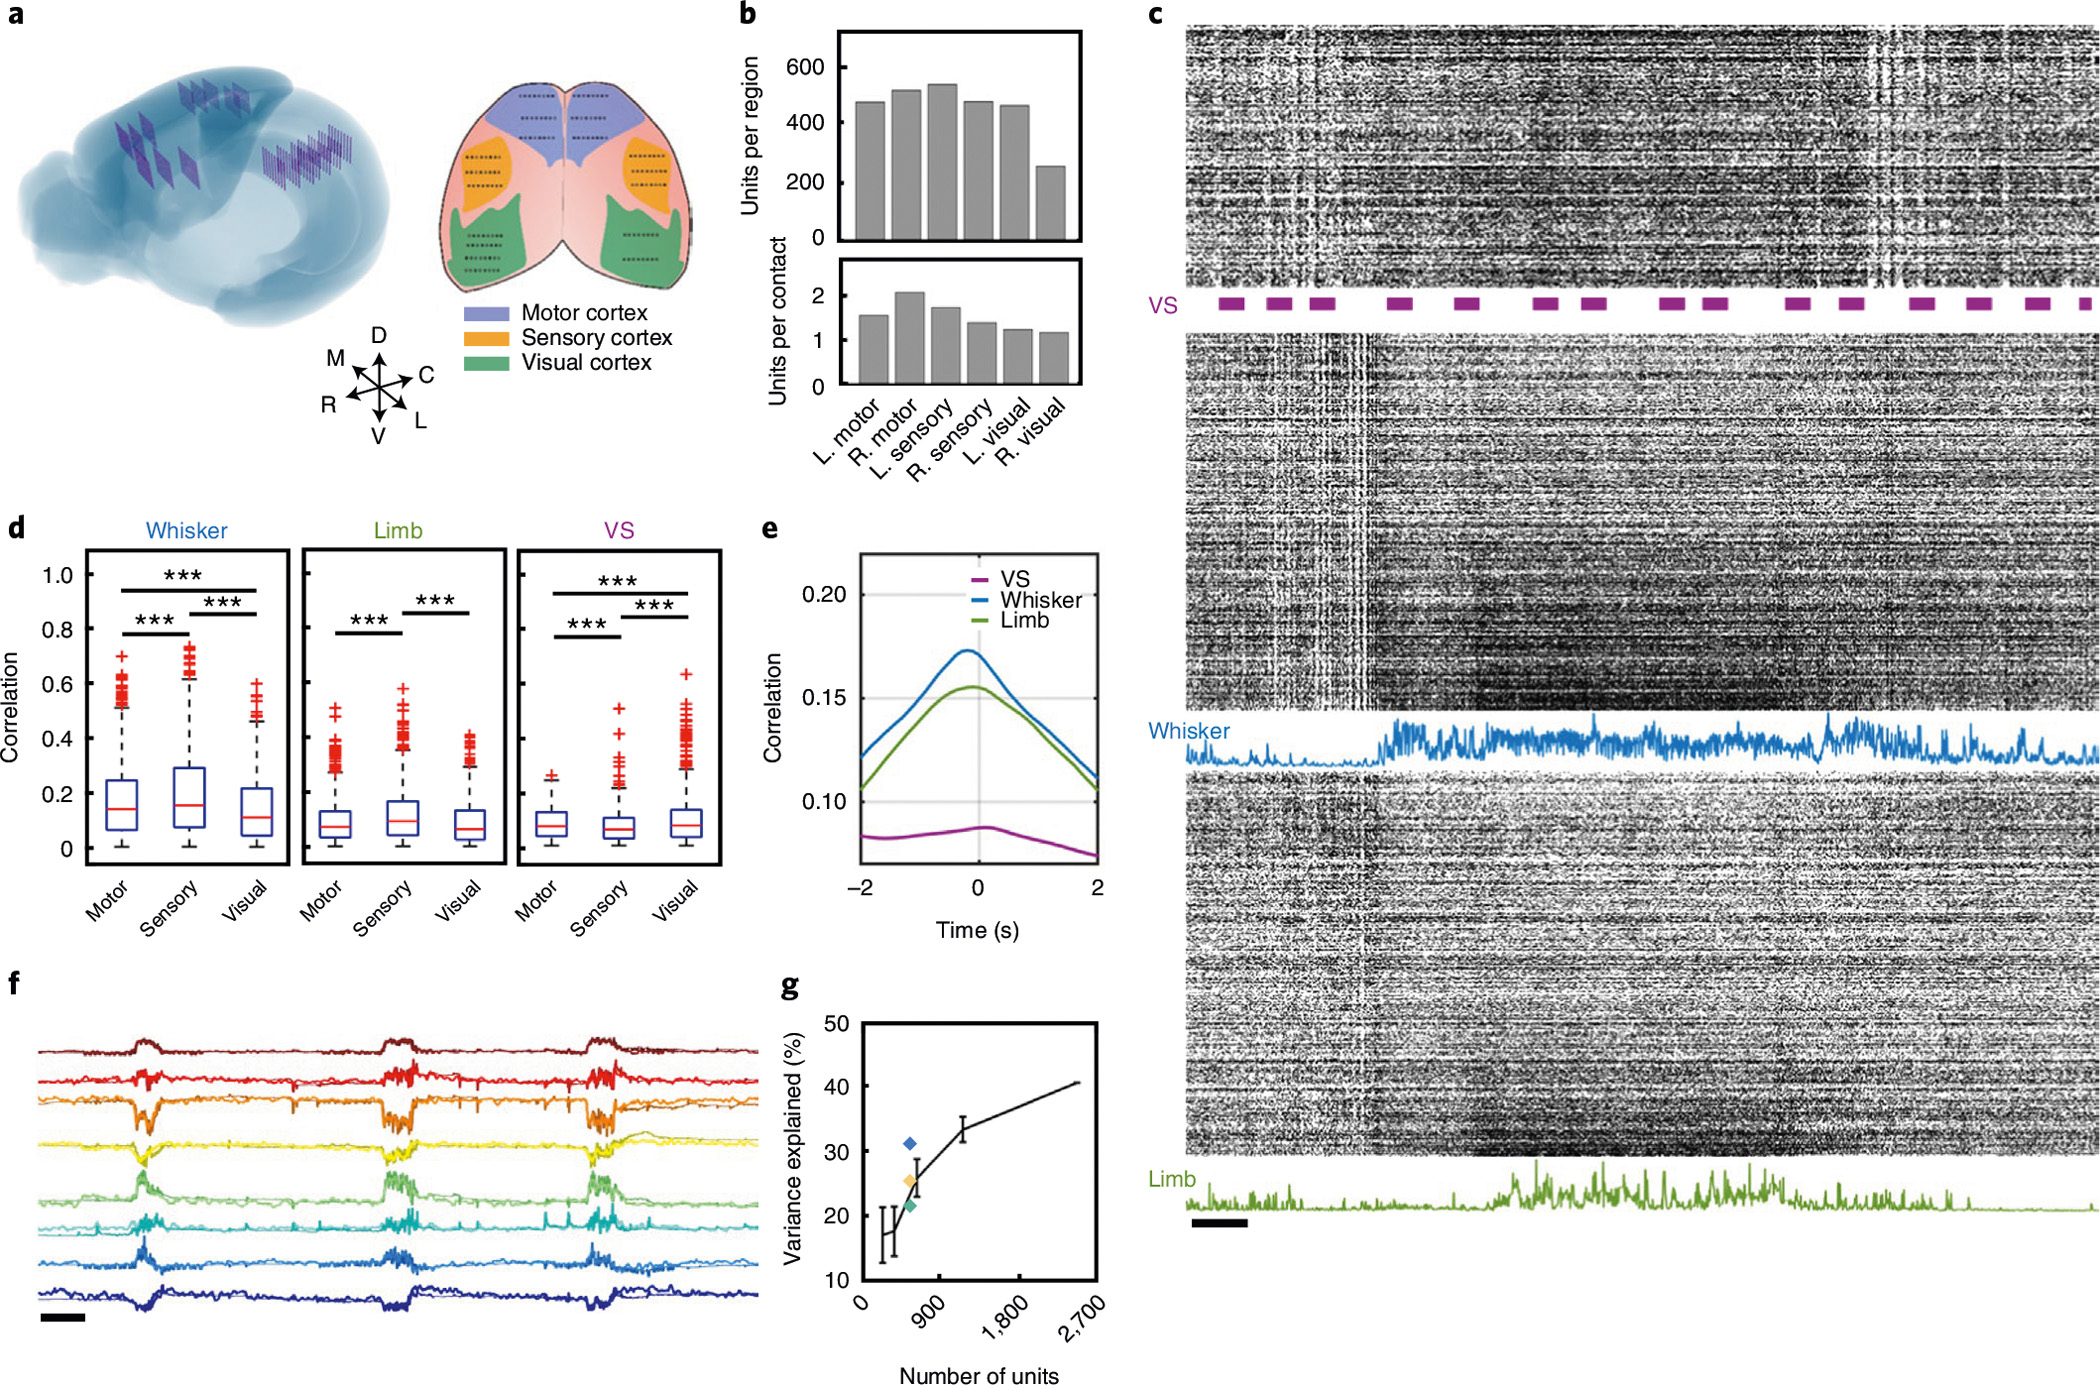
Fig. 6 |. Large-scale distributed recording in awake head-fixed mice and behaviour decoding.

a, Left: schematic showing reconstructed locations of all 144 recording shanks across the neocortex of mouse brain. Right: schematic representation of the surface implantation location with target brain region colour coded, each dot representing a 16-channel shank. b, Quantification of unit yield across six brain regions in a typical recording session. c, Representative spike raster of the 2,548 units recorded from the NET array. Three segments depict the units in the visual (top), sensory (middle) and motor (bottom) cortices. Bars mark the presence of visual stimuli. Blue and green curves plot the magnitude of the whisker deflection and limb motion, respectively. Scale bar, 1 s. d, Boxplots (median, upper and lower 25%, and outliers) showing the correlation between neural activity and three behavioural markers: whisker motion (left), limb motion (middle) and the presence of visual stimuli (right). Unpaired two-sided t-test, ***P < 0.001, Bonferroni corrected. e, Mean correlation of spike activity of all units and three biomarkers as a function of time latency. f, Prediction of eight latent behavioural states extracted from the face video with neural activity. Darker colours mark the real traces, and lighter colours mark the predicted traces. Scale bar, 10 s. g, Prediction performance (mean ± s.d., n = 5) as a function of brain regions used for decoding. Blue, motor area; yellow, sensory area; green, visual area; black, scaling of the prediction performance with the number of recorded units randomly selected from all regions.
