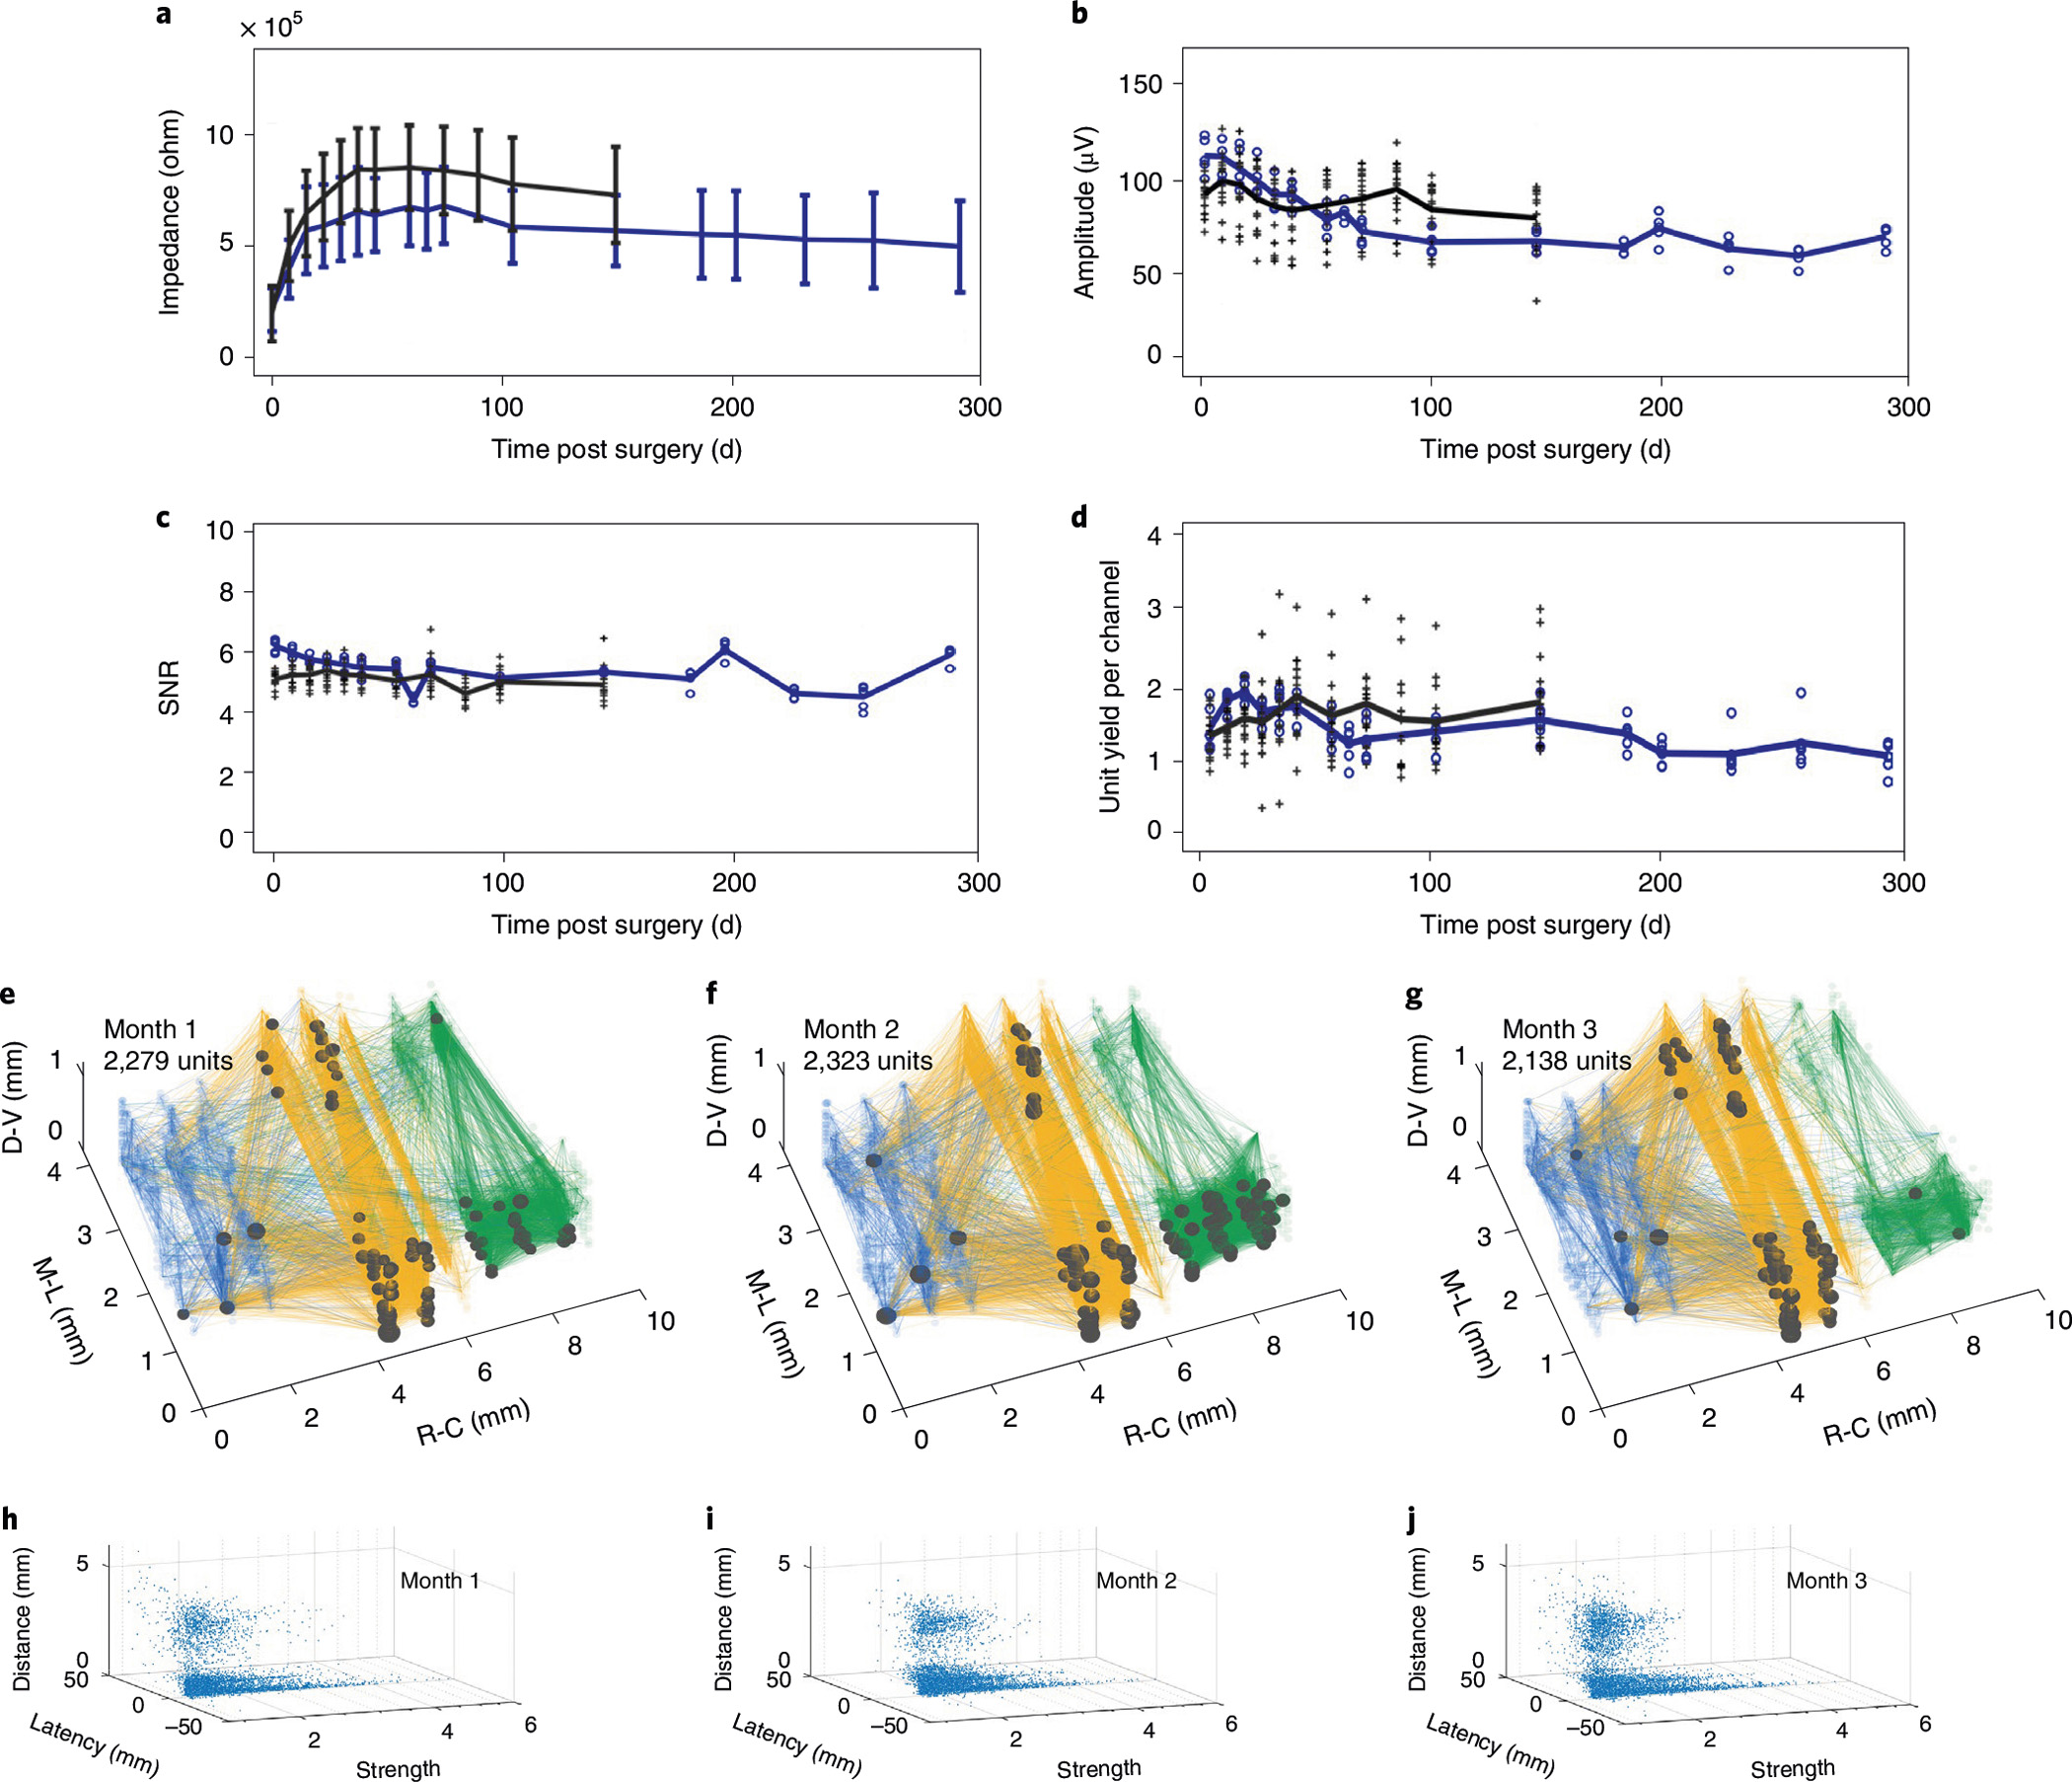
Fig. 7 |. Chronic stability of large-scale recordings by NETs, and evaluation of network stability over time.

a–d, Performance and stability of unit recordings from 21 128-channel modules over time. The averaged values of impedance (a), peak-to-valley amplitude (b), SNR (c) and single- and multi-unit yield (d) remained stable for the experimental duration, except for the initial changes within 60 days after implantation. Each cross and dot presents the module-averaged values from 16 modules that were tracked for 145 days and from the other 5 modules that were tracked for 290 days, respectively. Black and blue lines depict the average values of all 16 and 5 modules, respectively. Error bars in a denote s.d. e–g, Cortical network stability over 3 months demonstrated by the spatial distribution of the strong couplings (lines) and super nodes (dots) under visual stimuli. The size of the dots indicates the number of couplings from the node. Measurement time and total unit number are indicated. h–j, Distribution of the coupling strength, latency and separation between the pairs under visual stimulation at 1 (h), 2 (i) and 3 (j) months post implantation, respectively.
