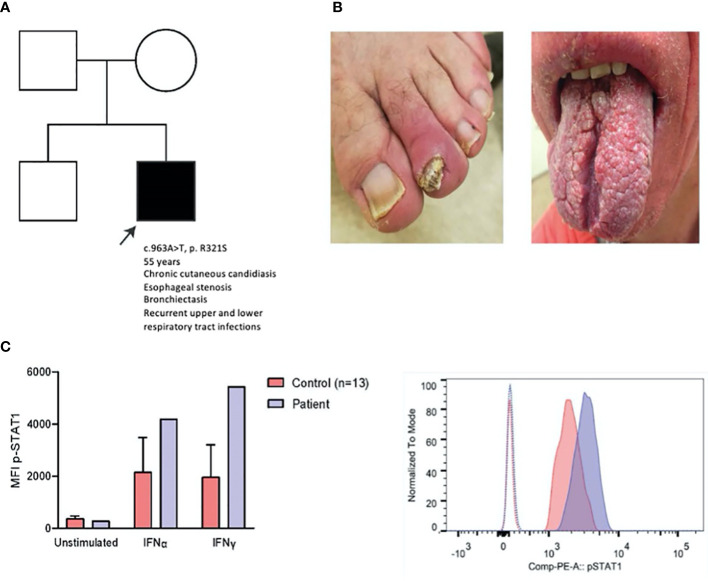
Figure 1.
Clinical, genetic and laboratory findings in a patient with STAT1 GOF. (A) Patient pedigree. c.963A>T was demonstrated using Sanger sequencing (data not shown), (B) Clinical pictures of onychomycosis (left) and impact of CMC on the tongue (right), (C) p-STAT1 MFI of patient and age-matched controls (n=13) on CD14+ monocytes unstimulated and after IFNα (2000 IU/ml) and IFNγ (2000 IU/ml) stimulation for 15 minutes (left); representative histogram of p-STAT1 on CD14+ monocytes in patient and healthy control (right) after IFN-γ stimulation (15 min). MFI: mean fluorescence index.

