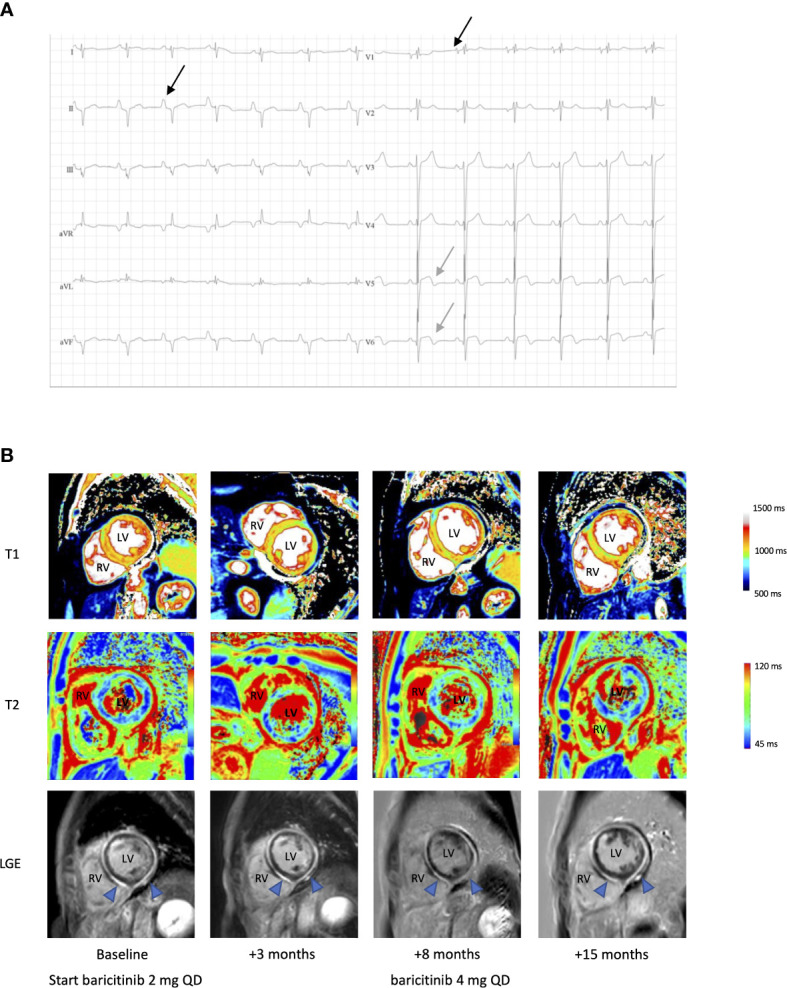
Figure 2.

Electrocardiographic and radiological findings in a patient with STAT1 GOF and myocarditis. (A) ECG, showing bi-atrial enlargement (black arrow, biphasic P wave in V1 and enlarged P wave in II), extreme rightward QRS axis deviation and biphasic T waves in V5-6 (grey arrow). (B) Cardiac native T1 map, T2 map and late gadolinium enhancement (LGE) MR images pre- and post-baricitinib. LV, left ventricle; RV, right ventricle. Blue arrow in LGE showing diffuse enhanced subepicardial and myocardial enhancement compatible with active myocarditis, partial regression after 8 months of treatment, with further reduction at 15 months after a dose increase.
