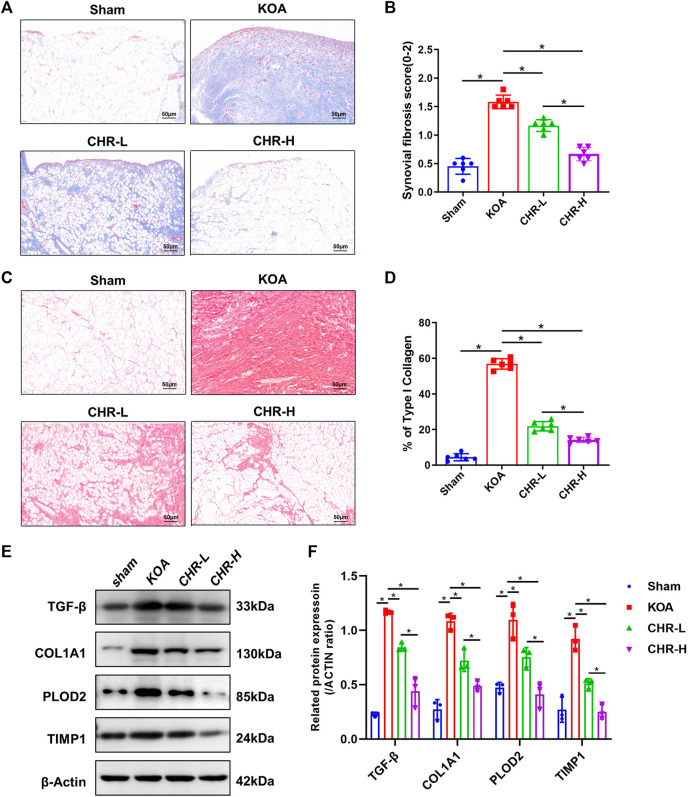
FIGURE 2.
CHR alleviates synovial fibrosis in KOA rats. (A) Representative images of synovial sections stained with Masson and examined at ×200 magnification. n = 6. Scale bars: 50 μm. (B) Quantitative analysis of the synovial fibrosis score. (C) Representative images of synovial sections stained with Sirius red and examined at ×200 magnification. n = 6. Scale bars: 50 μm. (D) Quantitative analysis of type I collagen (% area) in each group. (E) Immunoblot analysis of TGF-β, COL1A1, PLOD2, and TIMP1. (F) Protein levels of TGF-β, COL1A1, PLOD2, and TIMP1 in the groups. n = 3 per group. The data in this figure are presented as the mean ± standard deviation, and statistical significance was determined with one-way ANOVA followed by Tukey’s post hoc analysis. ∗p < 0.05.

