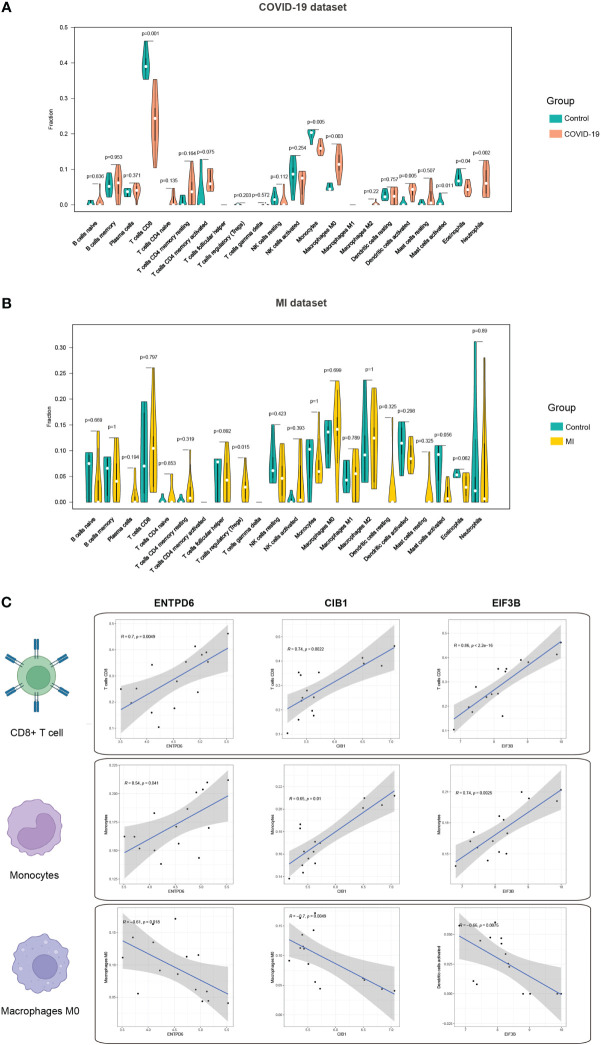
Figure 7.
Immune infiltration profile of three hub CORGs. (A) Violin plot depicts significant multiple immune cells between the COVID-19 and control groups. (B) Violin plot depicts significant multiple immune cells between the MI and control groups. (C) Correlation analysis of hub CORGs (ENTPD6, CIB1, and EIF3B) and significant immune cells (CD8+ T cell, monocyte, and macrophages M0). CORGs, COVID-19-related differentially expressed genes; MI, male infertility.

