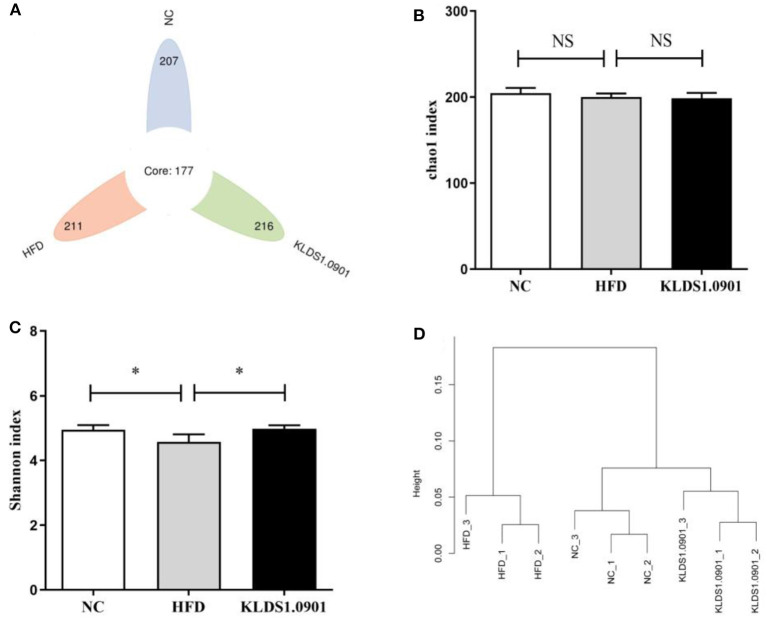
Figure 7.
L. acidophilus KLDS1.0901 administration regulates (A) the number of OTUs, (B) Chao 1 index, (C) Shannon index, and (D) the hierarchical clustering tree of weighted UniFrac distances. NC, normal control group; HFD, high-fat diet group; and KLDS1.0901, L. acidophilus KLDS1.0901 group. Values are expressed as mean ± SD (n = 8). *p < 0.05 indicated that there was a significant difference when compared with the HFD group. NS indicated that there was no significant difference when compared with the HFD group.

