
Figure 2.
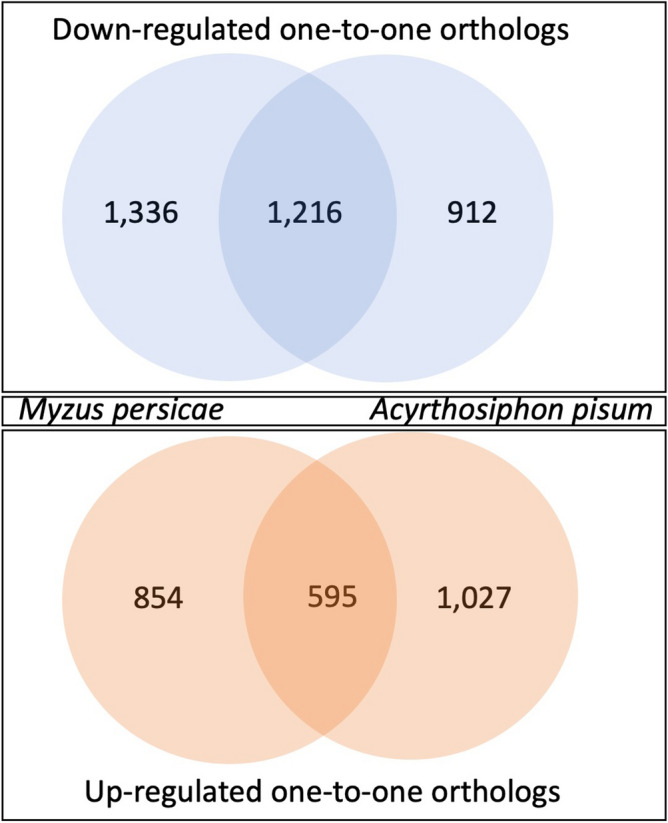
Overview of one-to-one orthologs that have significant differential gene expression in M. persicae and A. pisum for bacteriocytes compared to body tissues, where significance of up- or down-regulation between tissue types is determined for genes with an FDR corrected p-value 0.05 and fold change (FC) 1.5 (i.e. LogFC 0.5849). The shared portion of Venn diagrams indicate that the one-to one ortholog was significantly down-regulated (top panel) or up-regulated (bottom panel) in both aphid species. Un-shared portions of Venn diagrams indicate that the ortholog was only down-regulated (top panel) or up-regulated (bottom panel) in one of the aphid species (left side M. persicae; right side A. pisum).