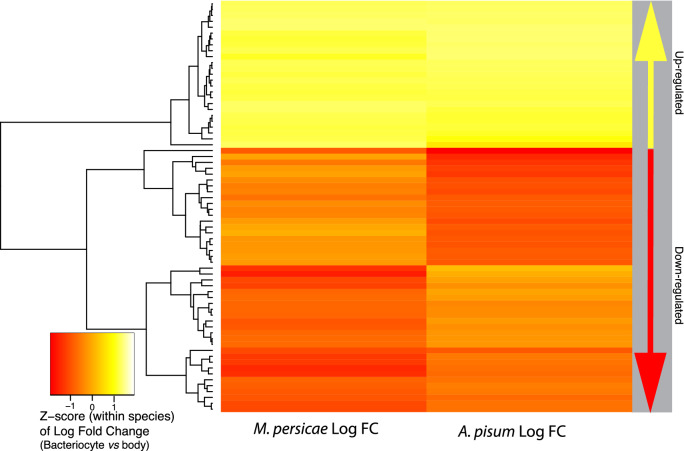
Figure 3.
Inter-species ortholog comparison of the top 70 one-to-one orthologs with the greatest variance in standardized Log fold-change expression of bacteriocytes compared to body tissues for both M. persicae and A. pisum. “Up-regulated” on the right panel indicates up-regulated in bacteriocytes compared to body tissue and “Down-regulated” indicates down-regulated in bacteriocytes compared to body tissue. Each row represents a shared one-to-one ortholog between M. persicae and A. pisum. See detailed ortholog gene numbers and GO terms in Supplemental Fig. S1.

