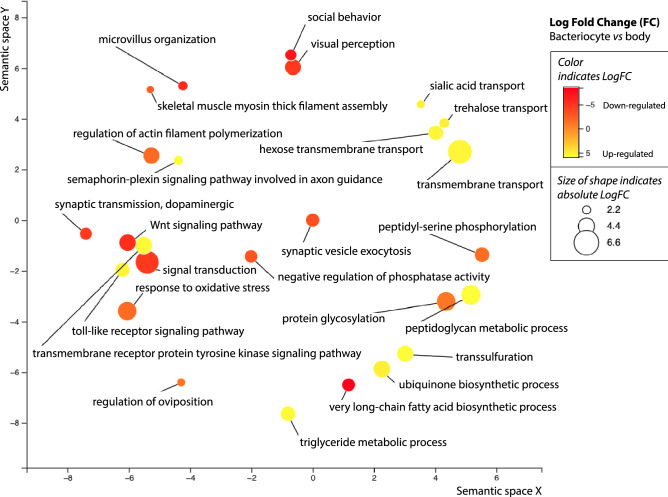
Figure 4.
Approximately 54% of the one-to-one orthologs identified in inter-species ortholog analysis have GO term annotations, which are represented as circles in the figure (see Supplemental Table S10 for detail). Multidimensional scaling (MDS) was used in Revigo to reduce the dimensionality of the matrix for these 38 GO terms based on pairwise similarities in biological function. The size of the circle and color indicates the Log fold change of the ortholog (bacteriocyte compared to body) within a unique GO term category.

