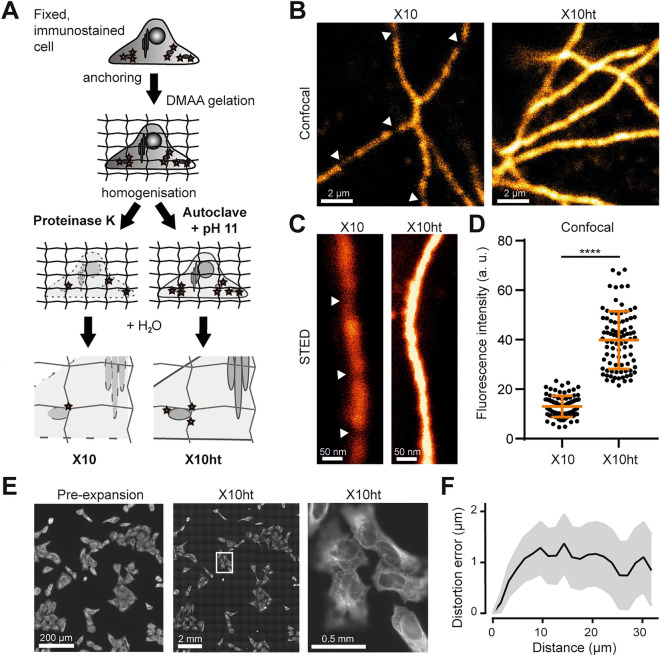
Figure 1.
X10ht enables confocal and STED imaging of tubulin immunostained in U2OS cells. (A) Scheme describing the differences between the X10 and X10ht protocols. (B) Representative images of tubulin under confocal or (C) STED imaging, indicating the difference in fluorescence intensity in both methods, what is quantified in (D). Using X10ht, we observed that the fluorescence signal appeared as a continuous decoration of the microtubules, while with X10 the loss of fluorophores results in “broken” microtubules (white arrows). N = ~ 90 regions of interest (ROIs) from two gels for each condition. (E) Exemplary epifluorescence images of the same region imaged pre- and post-expansion (X10ht) using the same 10 × objective. The region of the detail image is indicated by a white rectangle, showing expanded cells with a 100 × objective. (F) Distortion analysis of aligned pre- and post-expansion images. N = 3 automated measurements. Except panel E, scale bars, here and elsewhere, are given including the correction by the expansion factor. Data are presented as single ROI data points, mean ± SD.

