Figure 3.
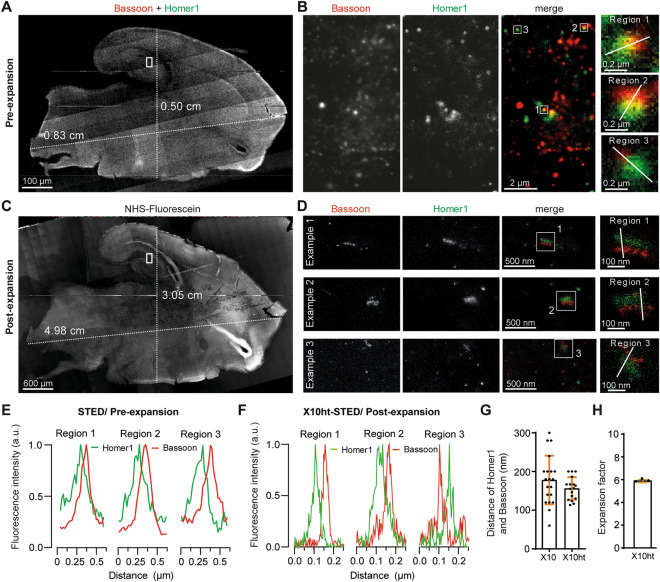
X10ht of 200 µm thick rat brain slices immunostained for the synaptic proteins Bassoon and Homer. (A) Epifluorescence tile image of merged channels displays a non-expanded 200 µm thick rat brain slice, containing the region of the hippocampal formation. (B) STED images of regions of the hippocampal formation (identified with white rectangles in A) show Bassoon (red) and Homer1 (green) in not expanded tissue. Zoom depict the marked regions (1–3). (E) Plots of the line scans over the zoomed areas. (C) Epifluorescence tile acquisition of the same brain slice after expansion labeled with NHS-Fluorescein, depicting the retention of tissue shape and the prolongation of the slice length from 0.83 to 4.98 cm and width from 0.5 to 3.05 cm. (D) Representative STED images of different regions from the C1 region of the hippocampus, showing highly resolved pre- (red) and postsynaptic (green) compartments. (F) The respective line scans are plotted, and the distance between the pre- and postsynaptic compartments is analyzed in (G). N = 20 ROI from two stained rat brain slices for not expanded STED; N = 17 ROI from 2 independent STED-X10ht experiments. (H) The graph shows an expansion factor of 6 with N = 3 independent experiments.

