Figure 6.
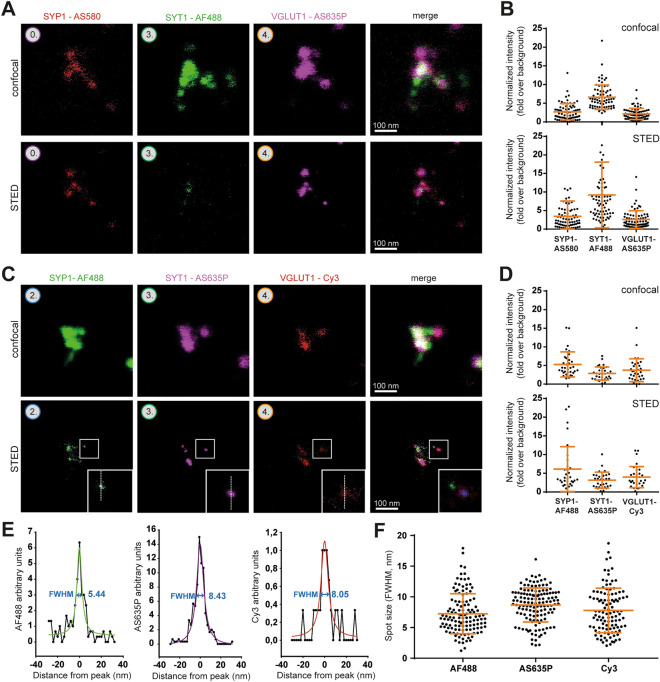
X10ht-STED imaging of isolated synaptic vesicles. (A) Representative confocal and STED images of one possible combination of amplification systems for SYP1, SYT1 and VGLUT1, revealed by AS580, AF488 and AS635P, respectively. (C) The protein targets and their amplification systems are combined with another selection of fluorophores. (B, D) The fluorescence intensities of all channels were analyzed, and indicated a sufficient signal-to-noise ratio for vesicle identification. N = 74 ROIs from 27 images in B, and N = 33 ROIs from 20 images in (D). (E) Line scans were drawn over the spots indicated in zoom panels in (C). The respective full widths at half maximum (FWHM) are indicated. (F) An analysis of spot sizes of different fluorophores with N = 72 analyzed AF488 spots from 20 images, N = 78 AS635P spots from 18 images, and N = 34 Cy3 spots from 14 images from two different experiments. Data for B, D and F are presented as individual data points, mean ± SD.

