Figure 1.
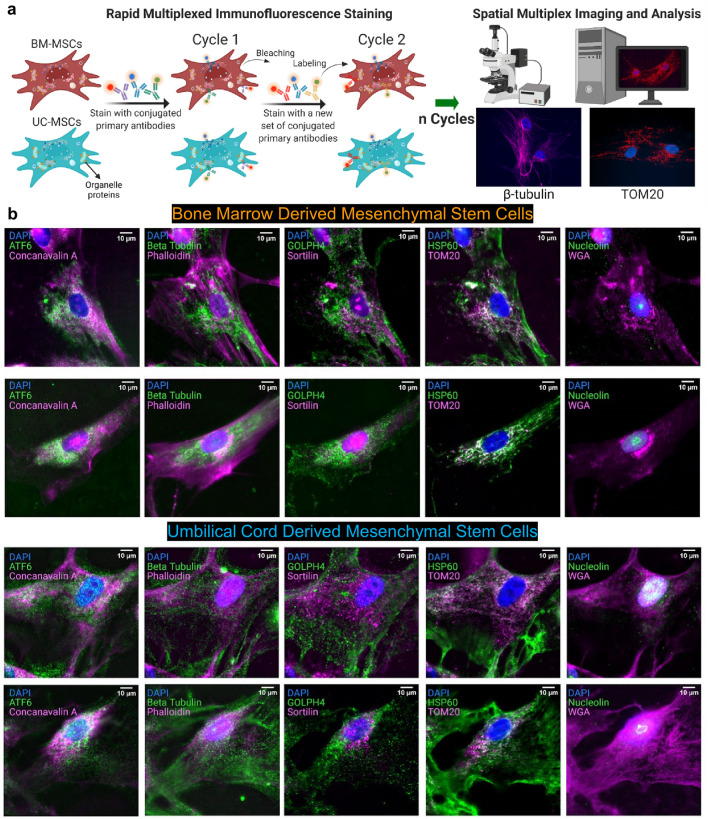
Ten-plex organelle mapping in mesenchymal stem cells using rapid multiplexed immunofluorescence (RapMIF). (a) Schematic of RapMIF for organelle analysis in MSCs. Each cycle contains 3 conjugated antibodies plus 4′,6-diamidino-2-phenylindole (DAPI) followed by bleaching of the signal before the next cycle consisting of 3 new antibodies. Imaging of the 3 antibodies before and after bleaching confirms the presence of signal and then signal removal. Multiplex imaging consists of multiple cycles (n) of antibody labeling and bleaching. BM MSCs (brown) and UC MSCs (cyan) are labeled with the same multiplex antibodies that target the same set of organelles. All images are acquired on Nikon widefield and registered across cycles to produce a final set of multiplex-labeled images. Example images show Beta Tubulin (magenta, left) and TOM20 (red, right) overlaid with the nucleus in DAPI (blue). Created with BioRender.com. (b) Visualization of organelle markers in single cells from BM MSCs and UC MSCs. Each row corresponds to a distinct single cell. The top 2 rows show BM MSCs and the bottom 2 rows show UC MSCs. Multiplexed markers for the same cell are displayed across 4 columns (Column 1: ATF6 & Concanavalin A, Column 2: Beta Tubulin & Phalloidin, Column 3: GOLPH4 & Sortilin, Column 4: HSP60 & TOM20, Column 5: Nucleolin & WGA). Each image displays DAPI with a pair of organelle markers in magenta and green. DAPI is used to register the signals across cycles. Signal removal is confirmed with a widefield microscope after bleaching each cycle. All scale bars 10 µm.

