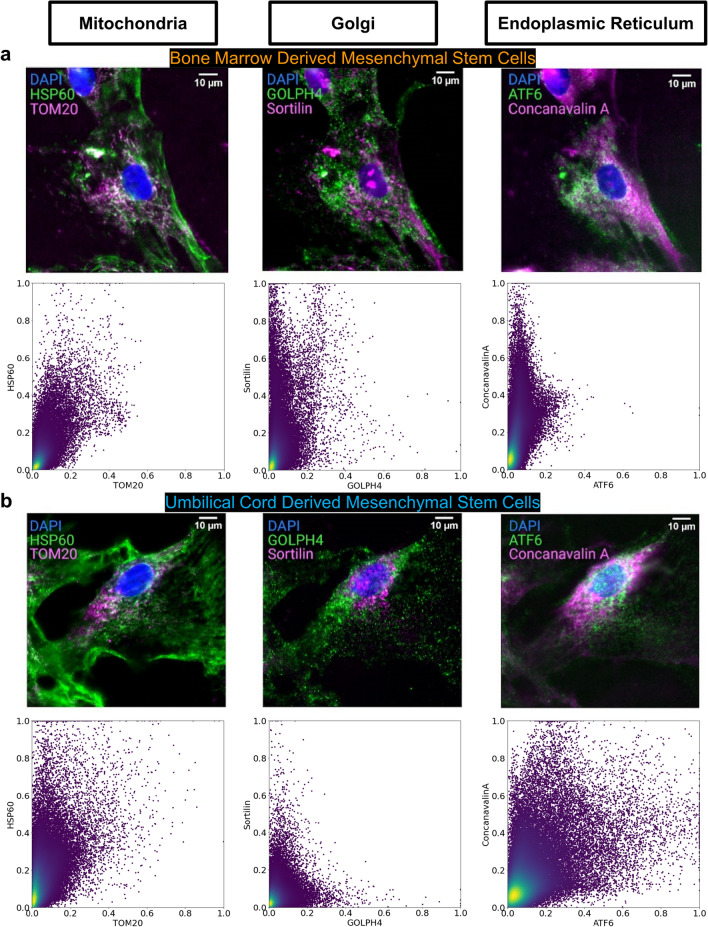
Figure 2.
Comparison of protein markers targeting the same organelles in BM MSCs and UC MSCs. (a) Single BM MSC example with various organelles across the columns. Each organelle is shown by a marker pair: HSP60 & TOM20 (mitochondria, left), GOLPH4 & Sortilin (Golgi, middle), ATF6 & Concanavalin A (ER, right). All scale bars 10 µm. The bottom row shows intensity scatter plots with 50,000 pixels for each marker pair colocalized within the same organelle. The x and y-axis indicate the min–max scaled intensity values of the markers. More colocalized pixels appear closer to the y = x diagonal while less colocalized pixels appear closer to either axis, belonging more to that particular marker. In BM MSCs, mitochondria antibodies are more colocalized than either Golgi or ER. (b) Single UC MSC example with various organelles across the columns. Each organelle is shown by a marker pair: HSP60 & TOM20 (mitochondria, left), GOLPH4 & Sortilin (Golgi, middle), ATF6 & Concanavalin A (ER, right). All scale bars 10 µm. The bottom row shows intensity scatter plots with 50,000 pixels for each marker pair colocalized within the same organelle. The x and y-axis indicate the min–max scaled intensity values of the markers. More colocalized pixels appear closer to the y = x diagonal while less colocalized pixels appear closer to either axis, belonging more to that particular marker. In UC MSCs, ER antibodies are more colocalized than either mitochondria or Golgi.

