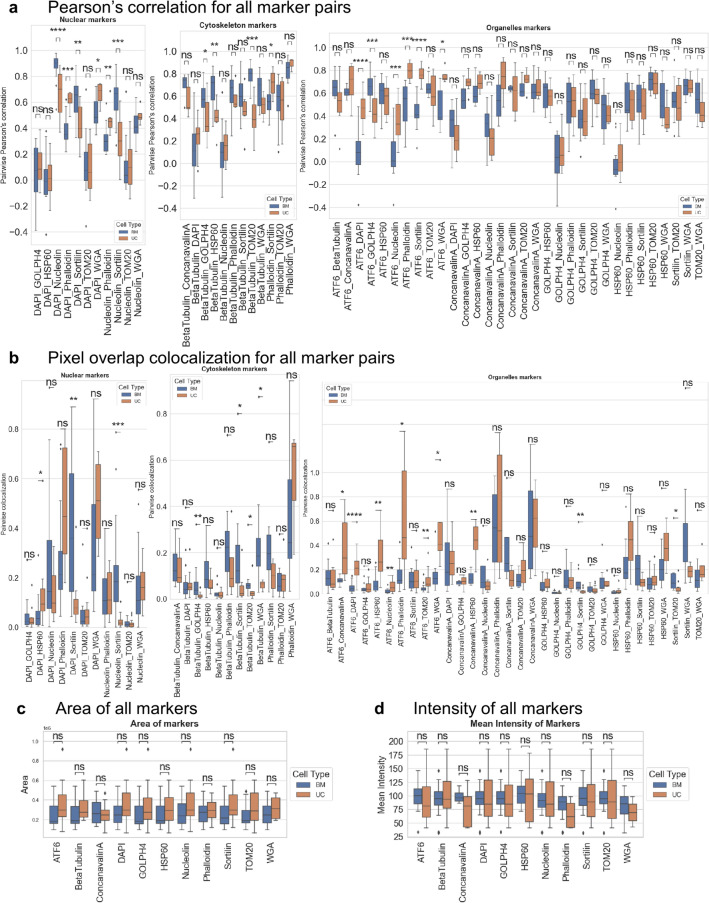
Figure 3.
Spatial analysis of organelle colocalization in BM MSCs and UC MSCs. (a) Boxplots of Pearson’s correlation of marker pairs per cell between all BM MSCs (blue) and UC MSCs (orange) categorized by nuclear, cytoskeleton, and organelle markers. Box plots show the median, first and third quartile, minimum, and maximum (excluding outliers). The outliers are marked as individual points. Stars denote the statistical significance for pairwise comparison. p value was calculated using the Mann–Whitney test (ns: p > = 0.05, ****p < = 0.0001). BM MSCs and UC MSCs exhibit the greatest differences in colocalized expression among pairs that include mitochondria (TOM20, HSP60), cytoskeleton (Beta Tubulin, Phalloidin), and endoplasmic reticulum (Concanavalin A). (b) Boxplots of pixel overlap colocalization values of marker pairs per cell between all BM MSCs (blue) and UC MSCs (orange) categorized by nuclear, cytoskeleton, and organelle markers. Box plots show the median, first and third quartile, minimum, and maximum (excluding outliers). The outliers are marked as individual points. Stars denote the statistical significance for pairwise comparison. p value was calculated using the Mann–Whitney test (ns: p > = 0.05, ****p < = 0.0001). UC MSC markers express a higher fraction of colocalized pixels in ER (ATF6, Concanavalin A) and mitochondria (HSP60) than those of BM MSCs, suggesting more active crosstalk of organelles in UC MSCs. (c) Comparison of the total area of 11 markers per cell between all BM MSCs (blue) and UC MSCs (orange) using boxplots. Box plots show the median, first and third quartile, minimum, and maximum (excluding outliers). The outliers are marked as individual points. Stars denote the statistical significance for pairwise comparison. p value was calculated using the Mann–Whitney test (ns: p > = 0.05, ****p < = 0.0001). UC MSC markers generally express larger and more variable areas than those of BM MSCs, suggesting that these organelles serve a higher energetic role in UC MSCs. (d) Comparison of the total intensity of 11 markers per cell between all BM MSCs (blue) and UC MSCs (orange) using boxplots. Box plots show the median, first and third quartile, minimum, and maximum (excluding outliers). The outliers are marked as individual points. Stars denote the statistical significance for pairwise comparison. p value was calculated using the Mann–Whitney test (ns: p > = 0.05, ****p < = 0.0001. Markers in UC MSCs express a larger range of intensities than in BM MSCs and thus these UC MSC organelles are in a more active state.

