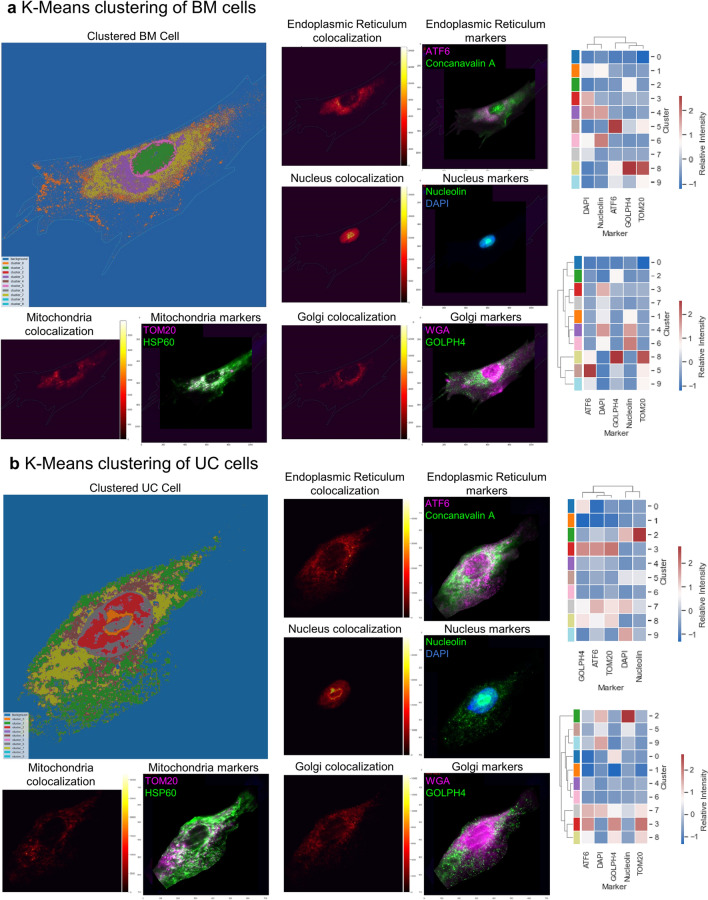
Figure 5.
Pixel level clustering of organelle markers in BM MSCs and UC MSCs. (a) K-Means clustering of intensities of markers for a single BM MSC. 10 clusters were chosen and colored back on the original cell (large left). Each cluster represents one distinct expression profile of the protein markers in the cells. A pair of images are shown for each organelle (mitochondria, Golgi, Nucleus, ER): (1) an overlay of the two markers that target the organelle (right) and (2) the colocalization of the two markers obtained by multiplying the two marker images pixel-wise from the right to highlight areas of overlap (left). Example: ATF6 and Concanavalin A forming the ER localization. Yellow values indicate areas of higher overlap while red values indicate areas of lower overlap. The right side shows the heatmap of marker intensity with a dendrogram based on marker intensities (right, top) and clustering results (right, bottom). From the dendrogram based on marker intensities, GOLPH4 and TOM20 are directly linked, along with ATF6. This suggests moderate crosstalk between ER and mitochondria, especially in cluster 8. Nuclear organelles DAPI and Nucleolin are associated in a separate cluster. (b) K-Means clustering of intensities of markers for a single UC MSC. 10 clusters were chosen and colored back on the original cell (large left). Each cluster represents one distinct expression profile of the protein markers in the cells. A pair of images are shown for each organelle (mitochondria, Golgi, Nucleus, ER): (1) an overlay of the two markers that target the organelle (right) and (2) the colocalization of the two markers obtained by multiplying the two marker images pixel-wise from the right to highlight areas of overlap (left). Example: ATF6 and Concanavalin A forming the ER localization. Yellow values indicate areas of higher overlap while red values indicate areas of lower overlap. The right side shows the heatmap of marker intensity with a dendrogram based on marker intensities (right, top) and clustering results (right, bottom). From the dendrogram based on marker intensities, ATF6 and TOM20 exhibit moderate crosstalk (clusters 3, 7, 8) but not as intensely as the BM MSC in (a).

