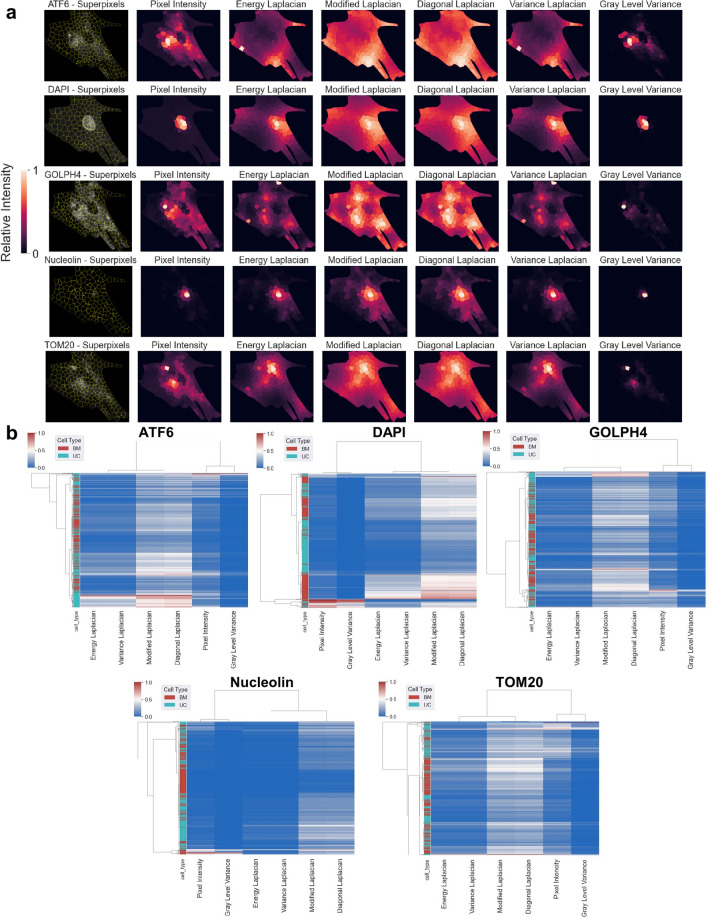
Figure 6.
Superpixel segmentation and texture analysis of organelle markers in BM MSCs and UC MSCs. (a) Superpixel segmentation and texture features using various cost functions (Pixel Intensity, Energy Laplacian, Modified Laplacian, Diagonal Laplacian, Variance Laplacian, and Gray Level Variance) calculated on superpixels for each marker of a single BM MSC. Each column represents a different superpixel method. Segmentation identifies subcellular, regional hotspots of organelles. Modified Laplacian and diagonal Laplacian create a more spread signal for all markers. Pixel intensity and variance Laplacian reveal discontinuous hotspots of GOLPH4, ATF6, and TOM20. (b) Heatmap of texture feature values for each superpixel in 7 BM MSCs and 7 UC MSCs for each marker. Each row denotes a single superpixel, and the column contains texture feature values for the corresponding superpixel. The feature values range from 0 (blue) to 1 (red) in each heatmap. Modified Laplacian and diagonal Laplacian yield the largest feature values. Each heatmap represents a different marker. UC and BM MSCs show similar overall patterns across various superpixels, implying that earlier, quantified differences are more minute and superpixel methods disguise these small differences when downsampling.

