Figure 7.
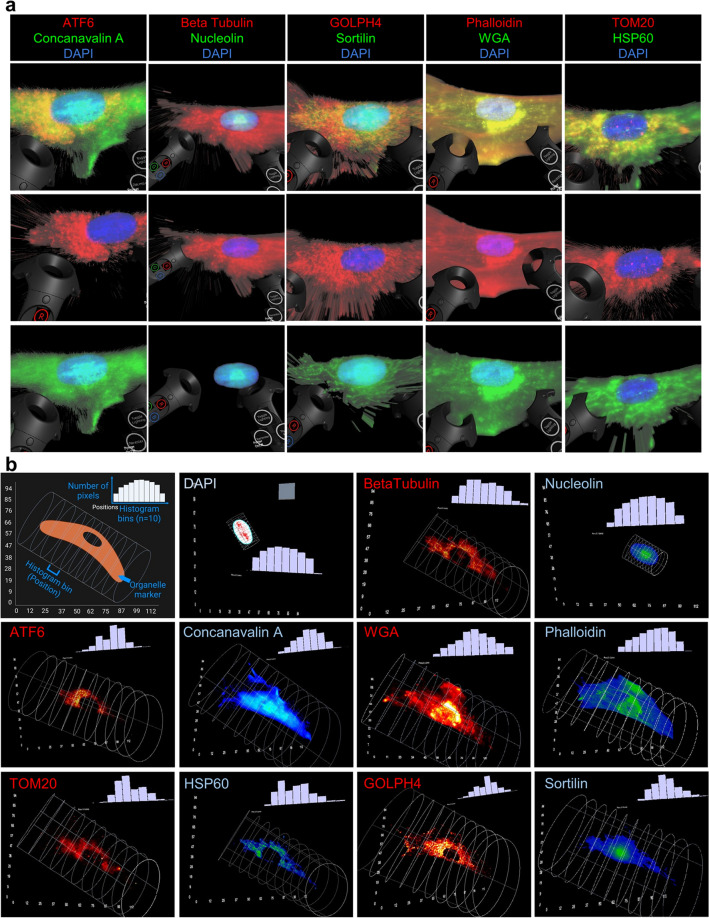
Virtual reality-based visualization and analysis of organelle imaging data in MSCs. (a) Visualization of organelle protein images (10 markers) for one BM MSC in ConfocalVR62. For each cell, the top shows the RGB image of the combined markers, while the bottom two show a single marker image in either red or green with DAPI. Different organelle markers are illustrated across the columns. Merged images are shown in the first row. Column 1: ATF6 (middle row) & Concanavalin A (bottom row), Column 2: Beta Tubulin (middle row) & Nucleolin (bottom row), Column 3: GOLPH4 (middle row) & Sortilin (bottom row), Column 4: Phalloidin (middle row) & WGA (bottom row), Column 5: TOM20 (middle row) & HSP60 (bottom row). Handset toggle switches used to interact with the image are shown on the left and right sides. (b) Visualization of organelle protein images (10 markers) for one BM MSC in Genuage63. The histogram of pixel count in 10 cylindrical bins (shown in white) of width 12.5 pixels (108 nm/pixel, bin width 1.354 µm) was plotted in the software. The top left image is an illustration explaining how cells are binned across the length to gauge spatial variability. In each box, red and blue colors illustrate the marker according to the upper left label. Beta Tubulin, ATF6, TOM20, and GOLPH4 show discontinuous regions of signal, supported by the uneven histograms, while the other signals are more continuous with more Gaussian histograms.

