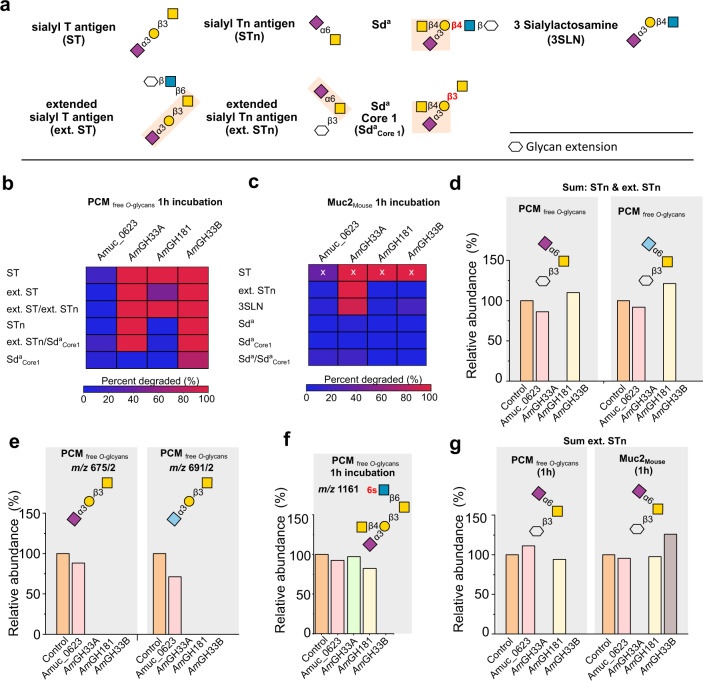
Fig. 2. The activity profiles of A. muciniphila sialidases.
a Overview of sialylated (denoted with “S”) epitopes, in the analyzed mucin and released mucin O-glycans. b, c Activity heat maps on sialylated epitopes in released porcine colonic mucin O-glycans (PCMfree O-glcyans) and mouse MUC2 attached O-glycans (MUC2Mouse), respectively after 1 h incubation. d, e Examples showing the broad substrate recognition of AmGH33A and AmGH33B towards α2,3- and α2,6-linked the Neu5Ac and Neu5Gc (light blue) sialic acid forms. f An example illustrating specificity differences between the investigated sialidases. g A comparison of activity profiles on the sum of sialylated extended Tn epitopes either in PCMfree O-glcyans and MUC2Mouse. The enzymatic reactions were performed with PCMfree O-glcyans or MUC2Mouse for 1 h and 24 h. The released PCM O-glycans were compared to non-treated controls, whereas MUC2 O-glycans were released after the enzymatic treatment and compared to non-treated controls. The relative abundances were calculated by integration of the LC-ESI/MS ion chromatogram peak of each glycan and normalising it to the total. The slightly higher relative abundances than the control in some incubations reflect the noise due to small variations in the mucin blots. The relative abundances are the basis for the activity heat map in panel. The “x” marked data are obtained from a single glycan structure, due to the low abundance of the sialyl T epitope in the MUC2Mouse sample. Sulphatyl substitutions are denoted with “s” in red.

