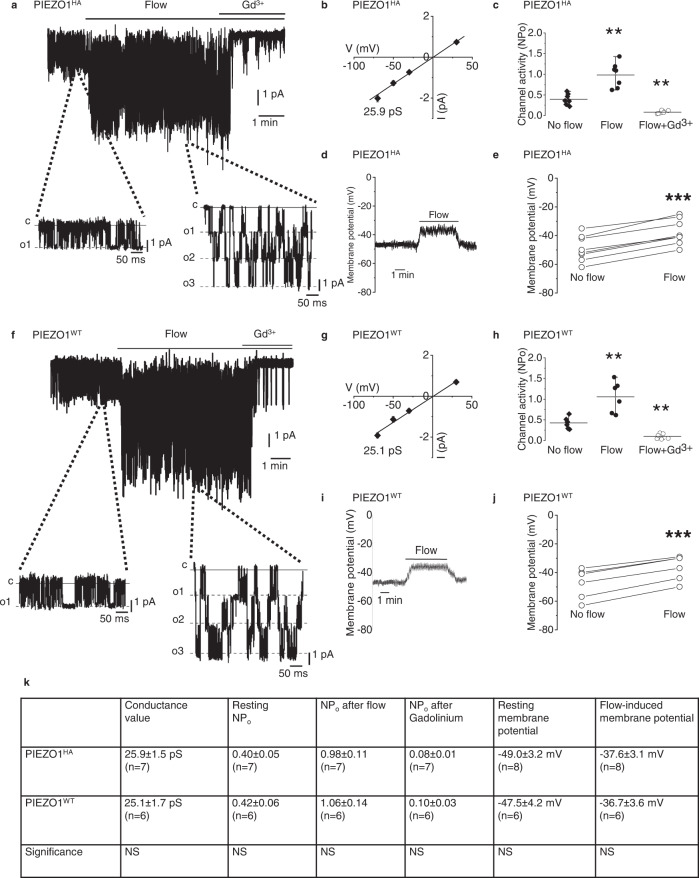
Fig. 1. Genetically engineered PIEZO1HA has comparable activity to wild-type PIEZO1 (PIEZO1WT) in mice.
a Example current recording from an outside-out patch from freshly isolated endothelium of second-order mesenteric artery of PIEZO1HA mouse. Holding potential, −70 mV. Fluid flow, 20 μl.s−1. Gadolinium (III) ion (Gd3+), 10 μM. Currents on expanded time-base are shown below in which c indicates the closed channel current level and o1, o2 and o3 the open channel current levels for simultaneous openings of up to 3 channels. b Mean ± s.e.mean unitary current amplitudes for flow-induced ion channel activity as in a plotted against holding voltage (n = 7 independent recordings). The fitted line indicates unitary conductance of 25.9 pS. c Channel activity indicated by NPo (number of channels per patch × probability of channel opening) for experiments of the type exemplified in a for no flow and flow conditions with or without Gd3+. Individual data points for each experiment are represented by symbols, superimposed on which are the mean ± s.e.mean values (**PFlow = 0.0001703, **PFlow+Gd3+ = 0.000165, n = 7 for each group). d Example trace of membrane potential measured from freshly isolated endothelium of second-order mouse mesenteric artery of PIEZO1HA mouse. Fluid flow, 20 μl.s−1. e Individual data points representing membrane potentials before and after flow as exemplified in d (***P = 0.00000343) (n = 7). Data points connected by a line were from the same recording. f Example current recording from an outside-out patch from freshly isolated endothelium of second-order mesenteric artery of PIEZO1WT mouse. Holding potential, −70 mV. Fluid flow, 20 μl.s−1. Gadolinium (III) ion (Gd3+), 10 μM. g Mean ± s.e.mean unitary current amplitudes for flow-induced ion channel activity as in b plotted against holding voltage (n = 6 independent recordings). The fitted line indicates unitary conductance of 25.9 pS. h Channel activity indicated by NPo (number of channels per patch × probability of channel opening) for experiments of the type exemplified in f for no flow and flow conditions with or without Gd3+. Individual data points for each experiment are represented by symbols, superimposed on which are the mean ± s.e.mean values (**PFlow = 0.000141, **PFlow+Gd3+ = 0.000241, n = 6 for each group). i Example trace of membrane potential measured from freshly isolated endothelium of second-order mouse mesenteric artery of PIEZO1WT mouse. Fluid flow, 20 μl.s−1. j Individual data points representing membrane potentials before and after flow as exemplified in i (P = 0.0000375, n = 6). Data points connected by a line were from the same recording. k Table of data comparing values from PIEZO1HA mouse and PIEZO1WT mouse, (mean ± s.e.m.). NS indicates no statistically significant difference between PIEZO1HA and PIEZO1WT. For the outside-out patch and membrane potential recordings, the external solution consisted of: 135 mM NaCl, 4 mM KCl, 2 mM CaCl2, 1 mM MgCl2, 10 mM glucose and 10 mM HEPES (titrated to pH 7.4 with NaOH). The patch pipette contained: 145 mM KCl, 1 mM MgCl2, 0.5 mM EGTA and 10 mM HEPES (titrated to pH 7.2 with KOH).

