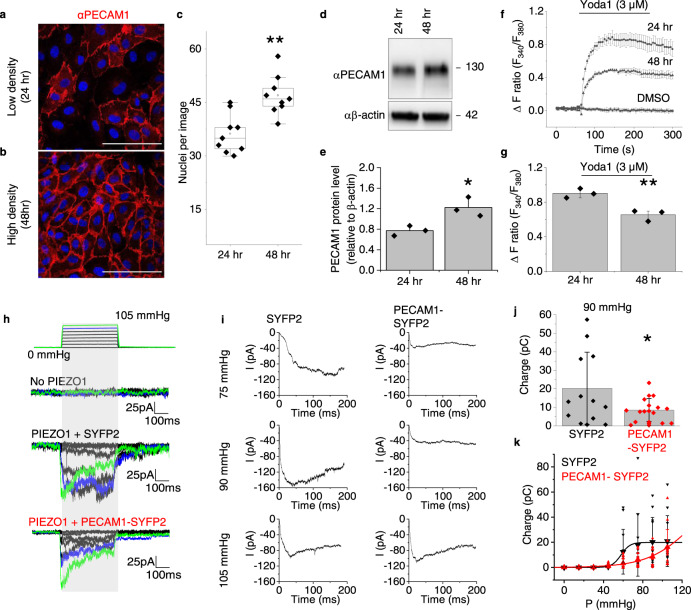
Fig. 3. PECAM1 suppresses PIEZO1 function.
a–g HUVEC data. Representative of 3 independent experiments, confocal images at low a and high b cell density, 24 and 48 h after plating. Cells were stained with αPECAM1 (red) and DAPI (nuclei, blue). Scale bar, 100 µm. c For experiments of the type in a and b, box plots of the number of nuclei per field of view at the 24 and 48 h time-points (n = 3, **P = 0.00264). Superimposed data points are nuclei numbers for individual images (24 h, N = 9 and 4 h, N = 9). d Representative western blot and e quantification of the PECAM1 in such blots d normalised to β-actin (mean ± s.e. mean, n = 3, *P = 0.04216, two sample t-test). Superimposed data points are quantification of independent western blots. f, g As for a and b but fura2-based Ca2+ measurement data. f Representative time-series traces showing effects of 3 μM Yoda1 at the two cell-culture time-points, compared with vehicle control DMSO (3 replicates per data point). g For data of the type in f, mean ± s.e.mean (n = 3) for peak Ca2+ signals evoked by Yoda1 (**P = 0.00705, two sample t-test). Superimposed data points are the mean intensity ratios for each independent repeat. h–k Data from outside-out patch recordings on T-Rex™-293 cells. h Example original current traces for empty cells without incorporation of PIEZO1 (No PIEZO1) or T-REx-293 cells with tetracycline-induced expression of human PIEZO1 after transient transfection with SYFP2 (PIEZO1 + SYFP2) or human PECAM1-SYFP2 (PIEZO1 + PECAM1-SYFP2). The holding potential was −80 mV and 200-ms positive pressure pulses were applied from 0 to 105 mmHg in 15 mmHg increments at intervals of 12 s as illustrated above the current traces (traces for 90 and 105 mmHg are highlighted in blue and green respectively). i Average PIEZO1 currents for cells transfected with SYFP2 (n = 12) or PECAM1-SYFP2 (n = 13) for each of the indicated pressure steps. j For the same type of data as h, electric charge compared at 90 mmHg for the two groups, suggesting statistically significant difference by t-test (*P = 0.01797). Superimposed individual data points for PIEZO1 + SYFP2 (black, n = 12) and PIEZO1 + PECAM1-SYFP2 (red, n = 15). k For the same type of data as h, mean ± S.D. and superimposed individual data points for PIEZO1 + SYFP2 (black, n = 11) and PIEZO1 + PECAM1-SYFP2 (red, n = 15), showing integrated electrical charge per pressure step plotted against pressure. F-test indicated statistically significant different between the pressure curves of the two conditions (***P = 7.45 × 10⁻⁸).

