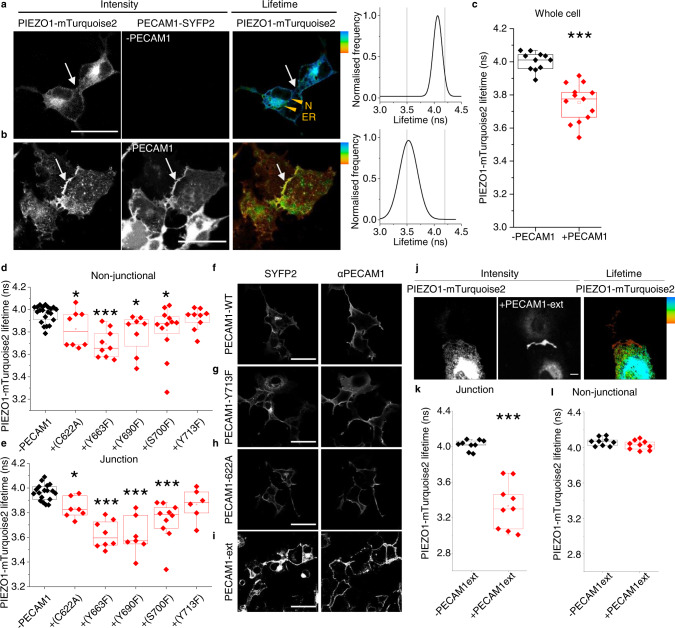
Fig. 4. PECAM1 drives PIEZO1 to cell-cell junctions.
Data are for non-permeabilised COS-7 cells expressing human PIEZO1-mTurquoise2 with human PECAM1-SYFP2. a–l FRET/FLIM studies. a PIEZO1-mTurquoise2 alone. The intensity image in which white is high intensity and lifetime image calibrated to the rainbow scale (3.5–4.2 ns). The white arrows point to a region of cell-cell contact and the orange arrowheads nucleus (N) and endoplasmic reticulum (ER). The graph on the right is the lifetime distribution with the limits of the rainbow scale indicated by vertical lines. b Similar to a except PIEZO1-mTurquoise2 with PECAM1-SYFP2 (+PECAM1). a, b Scale bars, 50 µm. c Box plot presentation of summary data of the type shown in a and b, showing peak lifetime for the entire cell (Whole cell). n = 4 independent experiment repeats for PIEZO1-mTurquoise2 alone (−PECAM1, black) and PIEZO1-mTurquoise2 plus PECAM1-SYFP2 cells (+PECAM1, red). ***P = 3.16 ×10⁻⁵. The superimposed data points are average lifetimes for different images, −PECAM1 (N = 11) and +PECAM1 (N = 13). d–h Data are for COS-7 cells expressing PIEZO1-mTurquoise2 only (−PECAM1) or co-expressing PIEZO1-mTurquoise2 and PECAM1-SYFP2 in which PECAM1 was mutated at the indicated amino acid residue. Box plot presentations of FRET/FLIM peak lifetime data measured at: d Non-junctional (intracellular) regions (*PC622A = 0.0381,***PY663F = 5.98 ×10⁻⁴; *P Y690F = 0.0431, *PS700F = 0.02136, PY713F = 0.13532); e Cell-cell junction regions (*PC622A = 0.014, ***PY663F = 3.56 ×10⁻⁴, ***PY690F = 7.76 ×10⁻⁴, ***PS700F = 2.07 ×10⁻⁴, PY713F = 0.1024). Data are for n = 3 independent experiment repeats. The superimposed data points are average lifetimes for different images, −PECAM1 (Nnon junctional = 21 and Njunctional = 18), +C622A (Nnon junctional = 8 and Njunctional = 7), +Y663F (Nnon junctional = 9 and Njunctional = 8), +Y690F (Nnon junctional = 8 and Njunctional = 7), +S700F (Nnon junctional = 12 and Njunctional = 10), +Y713F (Nnon junctional = 9 and Njunctional = 6). Confocal images showing sub cellular distribution of f wild-type (WT) PECAM1, g Y713F and h C622A as SYFP2 fluorescence and after immunostaining using antibody to PECAM1 extracellular domain (αPECAM1) in non-permeabilised cells. Images are representative of n = 3 independent experiments. Scale bars, 50 µm. i–l Data are for COS-7 cells expressing PIN-G-tagged N-terminal PECAM1-ex-SYFP2 alone (PECAM1-ex) or with PIEZO1-mTurquoise2. i Confocal image showing sub cellular distribution of PECAM1-ex. j Intensity images and lifetime image calibrated to the rainbow scale indicated at the top right corner (3.5–4.2 ns). Scale bar, 50 µm, applies to all images. Box plot presentations of FRET/FLIM peak lifetime data measured at: k Cell-cell junctions (***P = 4.12 ×10⁻⁴); l Non-junctional regions (P = 0.18533). Data are for n = 3 independent experiment repeats. The superimposed data points are average lifetime values junctions (−PECAM1ext, N = 9 and +PECAM1ext, N = 9) and non-junctions (−PECAM1ext, N = 9 and +PECAM1ext, N = 9) from separate images.

