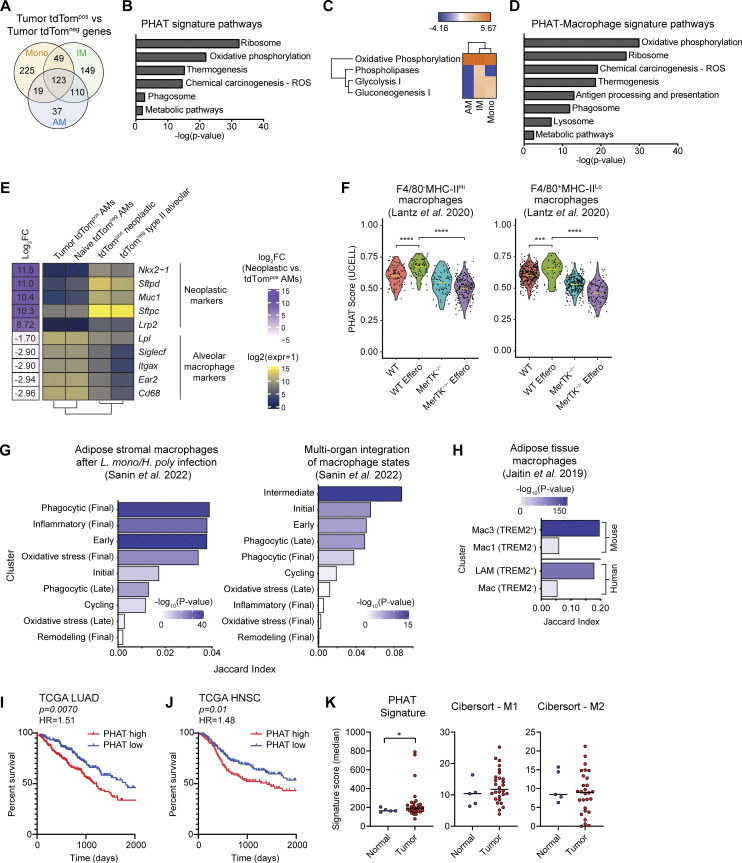
Figure 4.
PHAT gene signature defined using an autochthonous model correlates with other phagocytosis-associated macrophage populations and with decreased survival in human LUAD. (A) Venn diagram of genes upregulated (fold change > 1.2; FDR < 0.05) in PHAT AMs, IMs, and monocytes. (B) DAVID KEGG Pathway analysis of 123 PHAT signature genes shared in tdTompos AM, IMs, and monocytes. (C) Ingenuity Pathway Analysis of metabolic pathway z-score enrichment above twofold threshold in tdTompos AMs, IMs, and monocytes relative to tdTomneg AMs, IMs, and monocytes. (D) DAVID KEGG Pathway analysis of 233 PHAT-Macrophage signature genes shared in tdTompos AM and IM. (E) Heatmap showing log-normalized RNA-seq expression values of neoplastic cell and alveolar macrophage markers for sorted tumor tdTompos AMs, naive tdTomneg AMs, tdTompos neoplastic cells, and tdTomneg type II alveolar cells. Log fold-change values between phagocytic tdTompos AMs and neoplastic cells were determined using DESeq2 and are listed to the left of the heatmap. (F) Violin plots depicting PHAT signature score for WT and MerTK−/− (kinase-deficient) efferocytic murine macrophage subsets co-cultured with apoptotic cells (Lantz et al. 2020). Statistical significance was determined by unpaired Wilcoxon test. (G) Left: Jaccard index values measuring marker gene overlap between the PHAT-IM signature and adipose stromal murine macrophage subsets after classical (Listeria monocytogenes) and type II (Heligmosomoides polygyrus) immune challenges (Sanin et al. 2022). Right: Jaccard index values measuring marker gene overlap between the PHAT signature and murine macrophage subsets integrated across nine tissues and multiple inflammatory conditions (Sanin et al. 2022). (H) Jaccard index values measuring marker gene overlap between the PHAT-IM signature and murine and human adipose tissue macrophage subsets (Jaitin et al. 2019). LAM = lipid-associated macrophage. P values for G and H were determined using Fisher’s exact test. (I and J) Kaplan–Meier survival curve of 396 LUAD patients (I) or 390 head and neck squamous cell carcinoma (HNSC) patients (J), stratified by high (>60th percentile) or low (<40th percentile) PHAT signature enrichment (TCGA). P values were calculated by Cox regression. HR = hazard ratio. (K) Enrichment of PHAT, M1 CIBERSORT, or M2 CIBERSORT signatures in myeloid cells isolated from tumor or normal tissue (UCSF Immunoprofiler dataset). One-tailed t test with two-sample unequal variance, tumor vs. normal.

