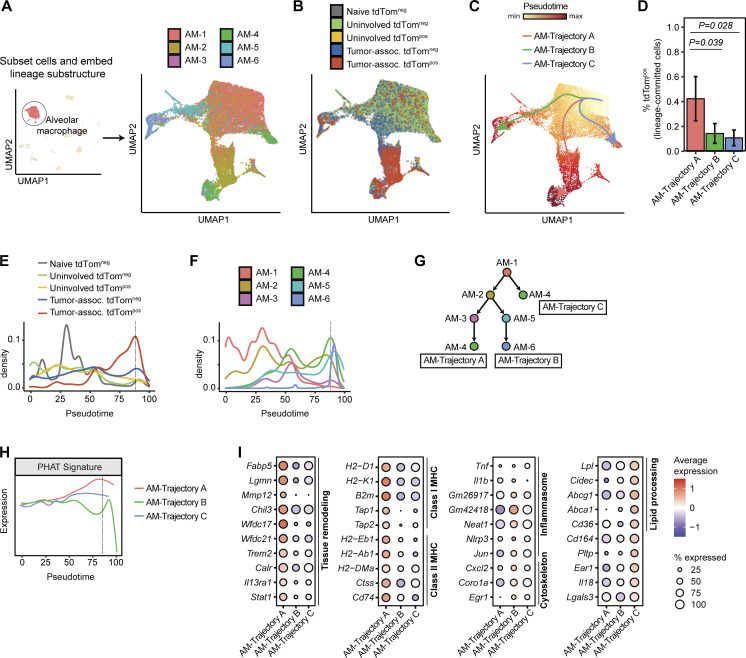
Figure 5.
Phagocytic AMs have distinct expression of genes involved in tissue remodeling in vivo. (A and B) UMAP projection of AMs following spectral embedding using diffusion maps. Cells are colored by AM cell state (A) or tissue and phagocytic status (B). (C) Trajectory inference of AMs using Slingshot. (D). Frequency of tdTompos cells for each maturation trajectory identified by Slingshot (n = 3 animals per group, Wilcoxon rank sum test). (E and F) Density plots across pseudotime for AMs grouped by tissue and phagocytic status (E) or by AM cell state (F). Dotted black line depicts the pseudotime value with highest frequency of tdTompos tumor cells. (G) Schematic depicting the relative maturation relationship between AM cell states as inferred by Slingshot and RNA velocity. (H) Density plot of expression of PHAT signature across pseudotime for each AM trajectory. Dotted black line depicts the pseudotime value with highest frequency of tdTompos tumor cells. (I) Bubble plots showing differentially expressed genes (Log2FC > 1.2 and P < 0.05) for each AM trajectory. Statistical significance between different trajectories was determined using MAST.

