Figure 7.
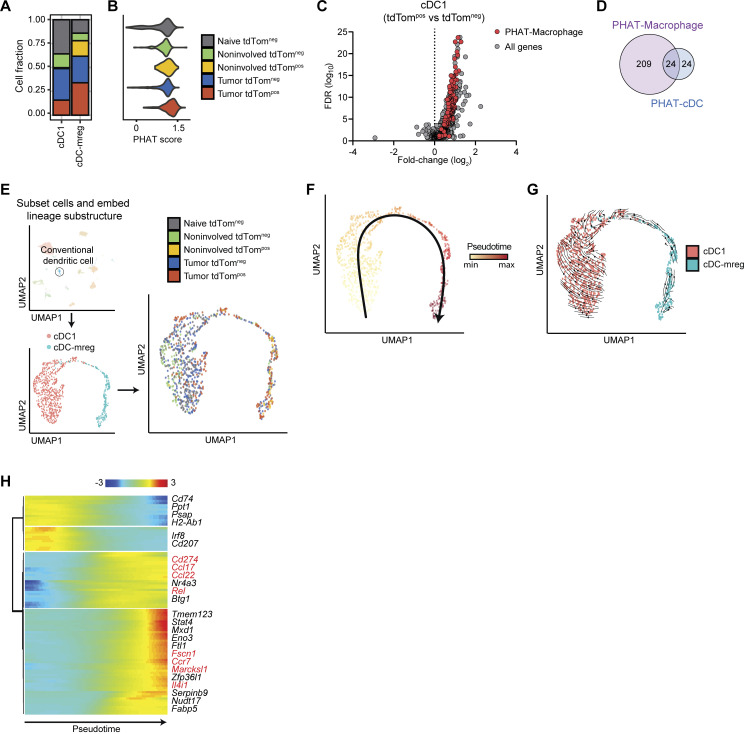
Tumor-associated tdTompos dendritic cells acquire an mregDC phenotype. (A) Cell frequency plots for each cDC cell state, delineated by tissue and phagocytic status. (B) Violin plot showing PHAT signature scores for cDC grouped by tissue and phagocytic status. (C) Volcano plot of differentially expressed genes between tdTompos and tdTomneg DC1s (cDC.Xcr1). PHAT-Macrophage signature genes are highlighted in red. Statistical significance was determined using MAST. (D) Venn diagram showing overlapping genes between PHAT-cDC signature and PHAT-Macrophage signature. (E–G) UMAP projections of cDCs, highlighting cDC subsets (E, left), tissue/phagocytic status (E, right), pseudotime-based trajectory inference using Slingshot (F), and dynamic RNA velocity trajectory inference (G). (H) Heatmap of genes that are differentially expressed along cDC trajectory. Gene groupings were determined by hierarchical clustering of genes by expression pattern. Genes highlighted in red depict mreg-DC marker genes reported by Maier et al., (2020). Statistical significance of genes across the single cDC trajectory was determined by Wald test after fitting the data using a generalized additive model.

