Figure 9.
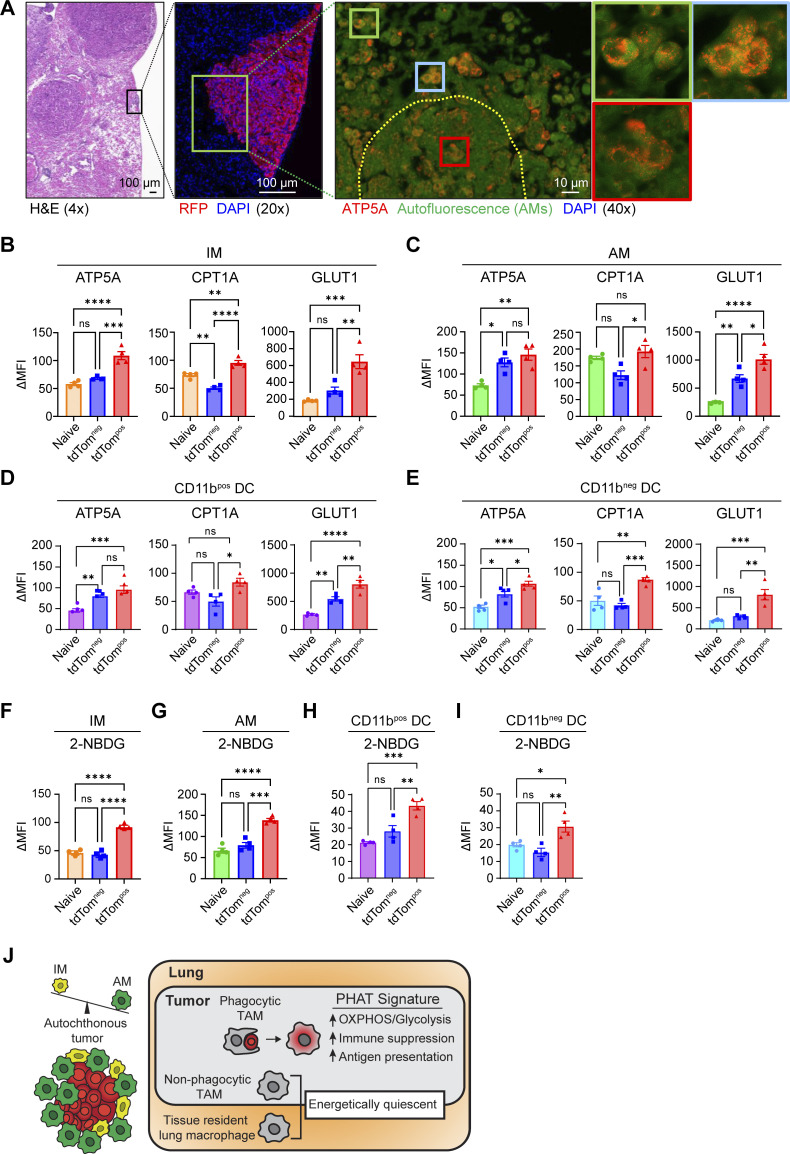
Phagocytic tumor macrophages upregulate both OXPHOS and glycolytic metabolism in vivo. (A) H&E and immunofluorescence imaging of autochthonous lung tumors stained for RFP, ATP5A, and DAPI. (B–E) Quantification of ΔMFI from tdTomneg and tdTompos IM (B), AM (C), CD11b-pos DC (D), and CD11b-neg DC (E) after intracellular MET-FLOW staining for metabolic enzymes. (F–I) Quantification of ΔMFI from tdTomneg and tdTompos IM (F), AM (G), CD11b-pos DC (H), and CD11b-neg DC (I) after intracellular quantification of 2-NBDG using flow cytometry. (J) Schematic detailing the predominance of AM populations found in autochthonous lung tumors and the metabolic and immune phenotypes of the PHAT signature found in phagocytic TAMs. Ordinary one-way ANOVA (*, P ≤ 0.05; **, P ≤ 0.01; ***, P ≤ 0.001; ****, P ≤ 0.0001; n.s., P > 0.05). Data are representative of three independent experiments.

