Figure S1.
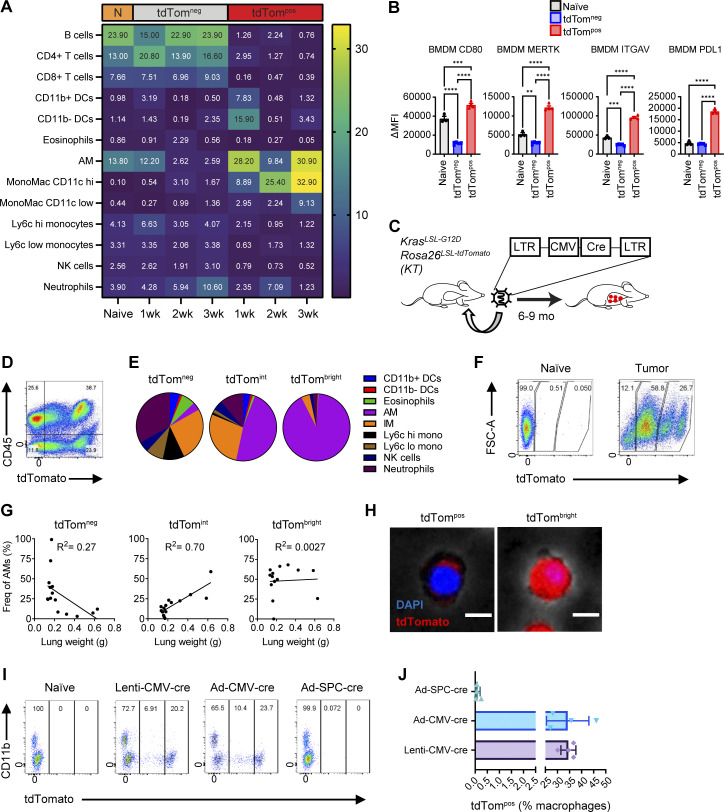
Identification of phagocytic versus transduced TAMs in syngeneic and autochthonous lung tumors in vivo. (A) Heatmap of immune cell frequencies within naive or syngeneic tumor-bearing mice. (B) MFIs of cell surface markers on tdTompos or tdTomneg BMDMs co-cultured with KPT SP110 cancer cells. (C) Schematic of lentiviral lung tumor initiation in KrasstopflG12D Rosa26stopfl-tdTomato mice. Ordinary one-way ANOVA (*, P ≤ 0.05; **, P ≤ 0.01; ***, P ≤ 0.001; ****, P ≤ 0.0001). (D) Flow cytometry plot of total live cells isolated from KT tumor-bearing mice. (E) Pie charts of the frequencies of myeloid cell subsets gated on tdTom-negative (tdTomneg), tdTom-intermediate (tdTomint), or tdTom-bright (tdTombright) CD45pos CD11b/cpos cells. (F) Flow cytometry plots of tdTombright, tdTomint, and tdTomneg lung macrophages gated on CD64pos CD24neg cells at in autochthonous lung tumors. (G) Scatter plots of the frequencies of tdTomneg, tdTomint, or tdTombright AMs and lung weights with linear regression calculations. (H) Fluorescent cell imaging of AMs from autochthonous lung tumors sorted from tdTomint or tdTombright. Scale bar, 10 μm. (I) Flow cytometry plots of total macrophages gated on CD64pos CD11b/cpos CD45pos cells isolated from lungs of KTai65;SpcCreER mice transduced with indicated viral vectors. (J) Frequencies of tdTompos macrophages from mice in I. Data are representative of at least three independent experiments.

