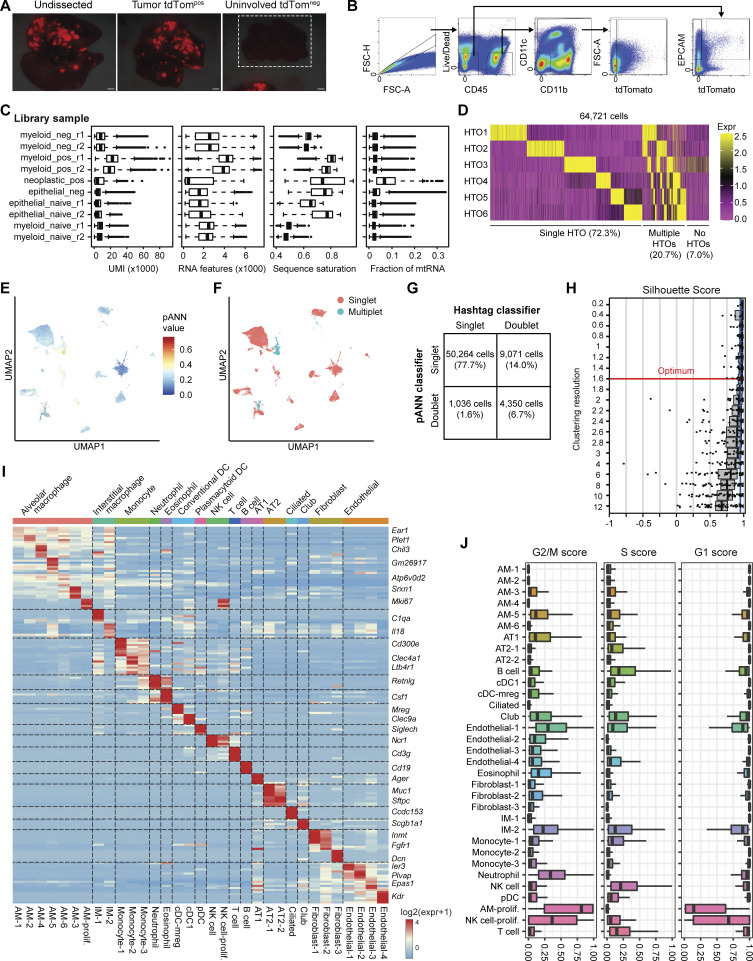
Figure S3.
Dissection, FACS, and scRNA-seq quality filtering of autochthonous KTai65;SpcCreER lung tumors. (A) Fluorescent images of whole lung and dissected lung isolated from SPCcreER mice. White box around the uninvolved tdTomneg image depicts uninvolved lung tissue, and a tdTompos tumor is shown in the same image to show light intensity settings of the fluorescence camera. Scale bar, 10 mm. (B) Gating strategy for cell sorting for scRNA-seq of tdTompos or tdTomneg myeloid and neoplastic cells from SPCcreER tumor-bearing mice or naive controls. (C) Sequencing quality metrics for each FACS-enriched 10X Chromium library preparation sample after removal of outlier and low-quality cell barcodes (see Materials and methods). Box plot lines correspond to the median and the interquartile range. (D) Heatmap showing log-normalized expression values of each of the six antibody hashtags used for each cell barcode. (E and F) UMAP projection of filtered cell barcodes colored by pArtificial Nearest Neighbors (pANN) score (E) and the resulting pANN classification of singlets vs. multiplets (F). (G) Confusion matrix showing the detection of cell barcode singlets and doublets by antibody-based sample hashing and by the pANN classifier. (H) Silhouette distribution plots for subsampled cells at different clustering resolution parameters of the Louvain algorithm, calculated using chooseR. Red line depicts optimal resolution parameter used for cell state classification. (I) Heatmap of all cell clusters identified and the averaged log-normalized expression of distinguishing marker genes. (J) Cell-cycle scores for G1, S, and G2/M phases of each cell state. Box plot lines correspond to the median and the interquartile range.

