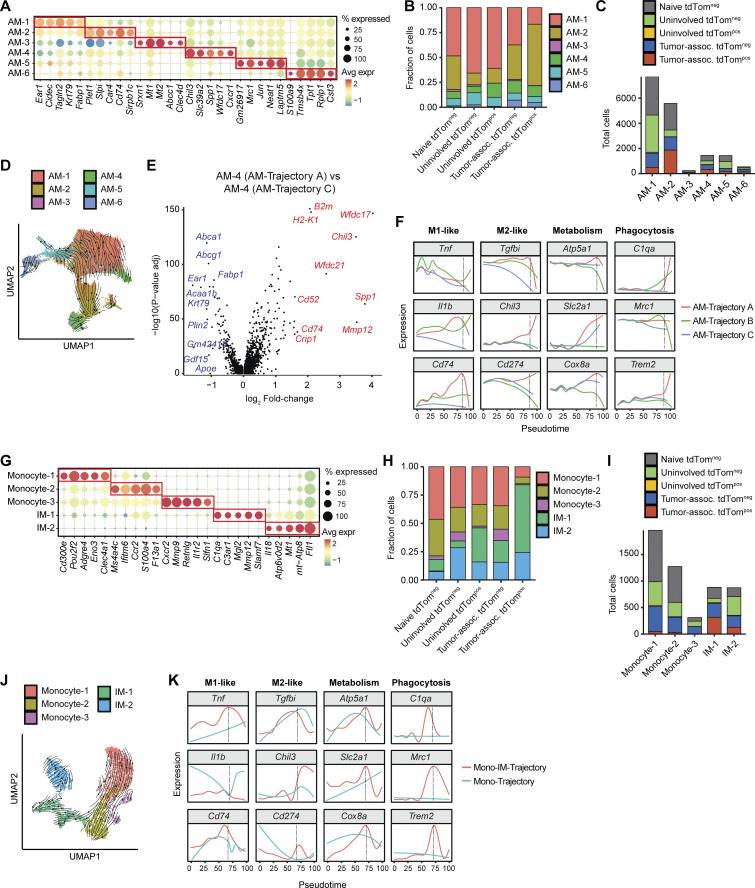
Figure S4.
Alveolar macrophage and interstitial macrophage transcriptional heterogeneity differs across lung tissue type and phagocytosis status. (A) Top five marker genes defining each AM cell state from KTai65;SpcCreER tumors and naive tissue. Marker genes were determined by Wilcoxon test. (B) Frequency of each AM cell state delineated by tissue and tdTom cell sorting status. (C) Absolute numbers of each monocyte and IM cell state, delineated by tissue and tdTom (phagocytic) status. (D) UMAP projection showing trajectory inference of AMs using dynamic RNA velocity modeling. Arrows represent the direction of AM maturation. (E) Volcano plot showing differential expression (MAST) between AM-4 cell state between AM-Trajectory A and AM-Trajectory C. Top 10 genes upregulated in AM-Trajectory A and AM-Trajectory C are shown in red and blue, respectively. (F) Density plot of selected genes across pseudotime for each AM trajectory. (G) Top five marker genes defining each monocyte and IM cell state from SPCcreER tumors and naive tissue. Marker genes were determined by Wilcoxon test. (H) Frequency of each monocyte and IM cell state delineated by tissue and tdTom (phagocytic) status. (I) Absolute numbers of each AM cell state, delineated by tissue and tdTom (phagocytic) status. (J) UMAP projecting showing trajectory inference of Mono-IM trajectories using dynamic RNA velocity modeling. Arrows represent the direction of Mono-IM maturation. (K) Density plot of selected genes across pseudotime for each IM-Mono trajectory.

